


MLB Video
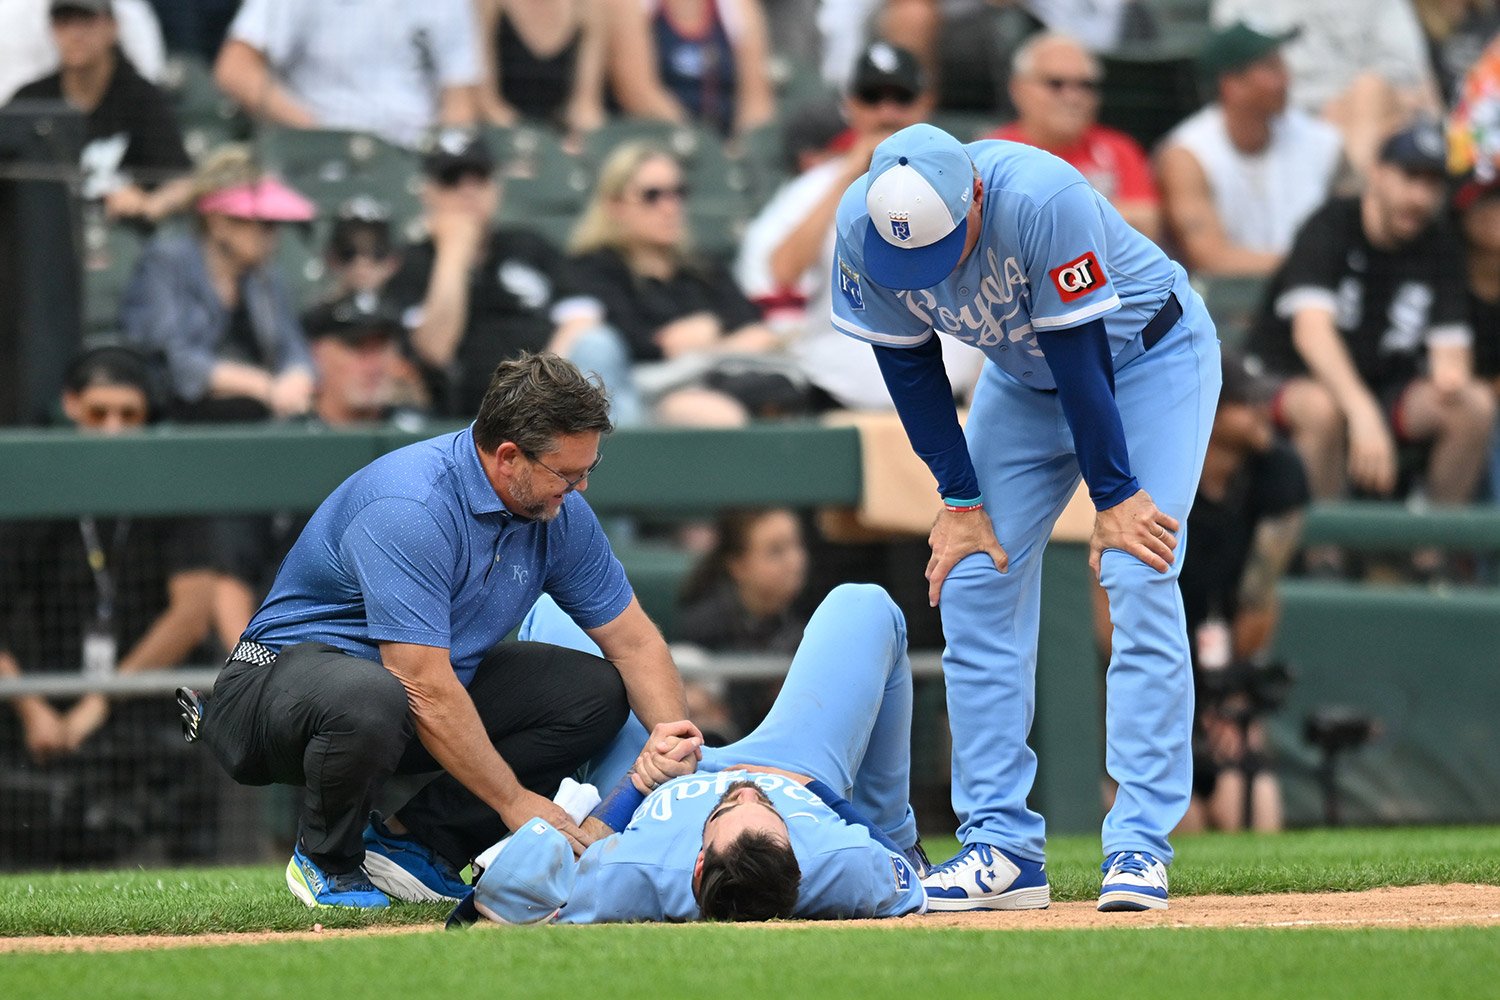
Hang around enough baseball fans, and you're guaranteed to hear a familiar refrain: "Man, we just can't stay healthy! We have to have way more injuries than any other team." Inspired by a recent FanGraphs article by Dan Szymborski, I decided to investigate this claim.
The Methods
All injury data was compiled from FanGraphs' RosterReSource - Injury Report database. The "Injury", "Time Frame", and "Status" dropdown boxes at the top of the page were all set to "All" or "Show All" to capture every injury that resulted in an IL stint from the 2021 through 2026 seasons. (Obviously, the 2026 season is still ongoing as of this writing, so the data is incomplete.) This data was transferred to a Google Sheets document where descriptive statistics (mean, standard deviation, etc.) and z-scores were calculated for total injuries and total days missed for each team. If an athlete was categorized as "out for the X season," the final day of the regular season was used to calculate the total days missed for that injury. A z-score greater than or equal to ±2.00 indicates a statistically significant result, meaning there is a 95% chance that the data cannot be explained by random chance.
The Results
There were a total of 5,346 IL placements and 236,153 days missed due to injury among all MLB teams from 2021 to 2026. The average number of IL stints was 178.2+/-28.8, while the average number of days missed was 7,871.8+/-1,303.0.
The San Francisco Giants had the most IL placements with 233, though this number did not reach statistical significance (z-score: 1.90), while the Cleveland Guardians had the fewest with 104 (-2.58). Other than the Guardians, no team's IL stints reached statistical significance; the aforementioned Giants and the St. Louis Cardinals were closest (132; -1.60).

The Los Angeles Dodgers experienced the most days missed with a whopping 11,051, which is statistically significant (2.44) and represents nearly 5% of all days missed during the analyzed timeframe. The St. Louis Cardinals experienced the fewest days missed with 4,856 (-2.31). The Guardians *just* missed statistical significance with 5,287 days missed (-1.98).

The number of IL stints compared to team winning percentage yielded an R-squared value of 0.004, indicating that 0.4% of the variation in winning percentage is explained by cumulative IL stints. Comparing days missed to winning percentage yielded an R-squared of 0.053, indicating that 5.3% of the variation is explained by cumulative days missed. But the trend line isn't in the direction one might expect; according to the charts below, more injuries and more days missed are associated with a greater winning percentage, even if the association is small.


Discussion
Unless you're a Dodgers fan, no, your team doesn't suffer statistically more injuries than any other team. Guardians and Cardinals fans should be quite happy, as their teams clearly employ some form of dark magic that keeps their athletes healthier than everyone else. All other fans need to chill. IL stints and cumulative days missed devoid of athlete production have very little impact on a team's ability to win.
If anything, the data suggest that a great way to negate any negative effects of injury on winning percentage is to spend a lot of money. Sure enough, the cumulative estimated payroll for all 30 MLB teams from Spotrac from 2021 to 2026 produces an R-squared of 0.309 (or 30.9% explanation of variance) when compared to winning percentage. While the number of days missed correlates in a positive direction with payroll (i.e. higher payroll equals more days missed), payroll has a much stronger positive correlation with winning percentage (r = .333 vs .556; weak compared to moderate).


Your favorite team's willingness to spend money may not keep them healthy or guarantee a World Series, but it does help.
Do you like the pitch clock?

Follow DiamondCentric For Major League Baseball News & Analysis


Like what you've read here? Check out our team-specific sites and expand your fandom!









-
 1
1


Recommended Comments
If you have an account on one of the following sites, you have a DiamondCentric account.
Twins Daily, Brewer Fanatic, North Side Baseball, Talk Sox, Jays Centre, Padres Mission, Royals Keep, Grand Central Mets, Fish On First.
Create an account or sign in to comment
You need to be a member in order to leave a comment
Create an account
Sign up for a new account in our community. It's easy!
Register a new accountSign in
Already have an account? Sign in here.
Sign In Now