


Philip Ruo
-
Posts
4 -
Joined
-
Last visited
-
Days Won
2
1 Follower

Recent Profile Visitors
753 profile views
Philip Ruo's Achievements


-
Net Runs While it is important for calls to be overturned, it is also important that teams are able to generate value from those challenges. Baseball Savant assigns a run value for all challenges. This metric accounts for the direct impact of a challenge. A successful challenge with the bases loaded and two outs will carry a different run value than the first pitch of an inning. Best Catchers In ABS Net Runs (min. 20 challenges) Player Team Net Runs For J.T. Realmuto Phillies 1.5 Carson Kelly Cubs 1.5 Tyler Stephenson Reds 1.1 Worst Catchers In ABS Net Overturns (min. 20 challenges) Player Team Net Runs For William Contreras Brewers -3.8 Drew Millas Nationals -3.6 Edgar Quero White Sox -3.6 Outcome Flips Catchers can help out their pitchers by saving their challenges for important times in the count. Removing walks or adding strikeouts can not only improve a pitcher’s box score but also dramatically impact a team’s win probability and overall success in the game, depending on the situation. Since this is a counting metric, it would be unfair to highlight the fewest flips. Best Catchers In Outcome Flips (min. 20 challenges) Player Team Strikeouts Flipped Walks Flipped Shea Langeliers Athletics 20 8 Victor Caratini Twins 17 6 Hunter Goodman Rockies 17 4 Tyler Stephenson Reds 17 4 Reasonable Challenges According to Baseball Savant, a "reasonable" challenge opportunity occurs when at least one of the following is true: The original call was incorrect; the pitch is within 3 inches of the strike zone edge and an overturn would gain at least 0.3 runs; the pitch carries an expected challenge rate of at least 20%. Reasonable challenges would indicate if a player is choosing the correct pitches to challenge and not needlessly wasting them on low-probability decisions. A challenge classified as “unreasonable” would certainly result in a confirmed call. Catchers need to balance making sure that their challenges are reasonable when taken, and not missing out on challenges that could have been overturned. Best Catchers In Reasonable Challenges (min. 20 challenges) Player Team % Challenges Considered Reasonable % of Reasonable Challenge Opportunities Taken Mitch Garver Mariners 87% 27% Hunter Goodman Rockies 86% 35% Sandy Leon Braves 86% 38% Worst Catchers In Reasonable Challenges (min. 20 challenges) Player Team % Challenges Considered Reasonable % of Reasonable Challenge Opportunities Taken Drew Millas Nationals 49% 21% Brandon Valenzuela Blue Jays 50% 15% Johnny Pereda Mariners 50% 23% Verdict Which catchers stand out when combining all of these aspects? Best Overall ABS Catcher: Hunter Goodman - Rockies Goodman consistently ranked among the league leaders across nearly every metric. In the metrics where he fell outside of the top three, he ranks 13th at 67% (while having a larger sample size than all but one of the catchers ahead of him) and 4th in net runs with 0.9 runs. His strong decision-making and ability to reverse key outcomes led him to be one of MLB’s top performers in ABS challenges. Worst Overall ABS Catcher: Drew Millas - Nationals Millas is the only catcher who challenges fewer than half of the reasonable challenge opportunities. Despite having the 16th-most challenges (out of 62 catchers with at least 20 challenges), he only has four flipped calls. Only three catchers in this group have fewer flipped calls than he does. He has the second fewest net runs, but the leader Contreras has 60 more challenges than Millas, with only 0.2 fewer runs. Millas was also in the bottom five in both net turnovers and success rate. He will look to improve in these areas going into the second half of the season. View full article
-
Challenge Accepted: The Best and Worst ABS Catchers of 2026's First Half
Philip Ruo posted an article in MLB
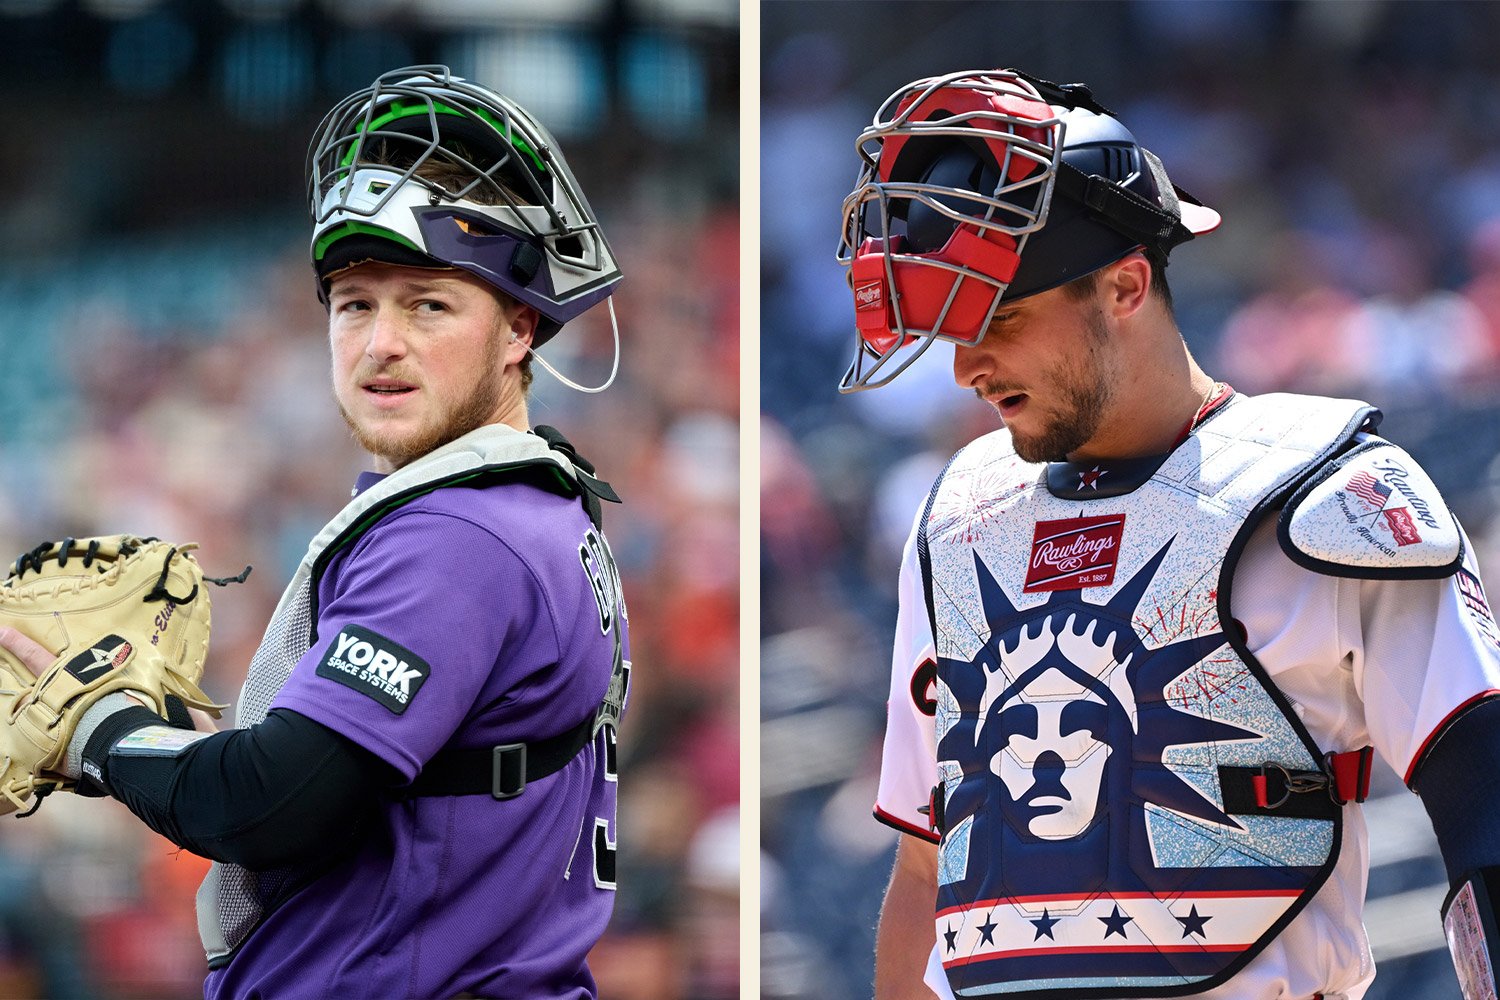 For the 2026 season, MLB implemented the Automated Ball-Strike (ABS) Challenge System. Although the system debuted during spring training in 2025, 2026 marked its first season in competitive games. Now that the season has reached the All-Star break, catchers have had the first half of the season to get used to the system and develop strategies. Some players have emerged as some of the best (and worst) in the league at challenging calls behind the plate. Baseball Savant provides leaderboards and summaries for all catchers’ performances, and all data referenced below can be found from their leaderboard. Success Rate Success rate is measured by total overturned calls divided by the number of challenges. While this metric does not necessarily indicate overall value, it is important to get calls right when challenges are made and not waste one of the two challenges each game. However, the success rate does not account for the quality or difficulty of the challenges themselves. Best Catcher ABS Success Rate (min. 20 challenges) Player Team Challenges Won Total Challenges Success Rate J.T. Realmuto Phillies 31 39 79% Carson Kelly Cubs 33 43 77% Sandy Leon Braves 16 21 76% Worst Catcher ABS Success Rate (min. 20 challenges) Player Team Challenges Won Total Challenges Success Rate Jhonny Pereda Mariners 7 22 32% Samuel Basallo Orioles 17 41 41% Brandon Valenzuela Blue Jays 15 36 42% Net Overturns Net Overturns measures how often a catcher overturns calls compared with what would be expected if an average catcher had faced the same pitches. Unlike the success rate, net overturns measures a catcher’s decision-making by how they compare to other catchers’ tendencies if faced with a similar decision. This is calculated by: (challenges won - expected challenges won) - (challenges lost - expected challenges lost) Best Catchers In ABS Net Overturns (min. 20 challenges) Player Team Challenges Won vs Expected (+ is good) Challenges Lost vs Expected (- is good) Net Overturns Dillon Dingler Tigers 9.7 -13.2 23.0 Hunter Goodman Rockies 17.8 -2.4 20.2 Victor Caratini Twins 21.3 6.3 15.0 Worst Catchers In ABS Net Overturns (min. 20 challenges) Player Team Challenges Won vs Expected (+ is good) Challenges Lost vs Expected (- is good) Net Overturns Samuel Basallo Orioles -15.6 3.8 -19.4 Edgar Quero White Sox 4.4 23.4 -19.0 Carter Jensen Royals -12.9 1.1 -14.0 Net Runs While it is important for calls to be overturned, it is also important that teams are able to generate value from those challenges. Baseball Savant assigns a run value for all challenges. This metric accounts for the direct impact of a challenge. A successful challenge with the bases loaded and two outs will carry a different run value than the first pitch of an inning. Best Catchers In ABS Net Runs (min. 20 challenges) Player Team Net Runs For J.T. Realmuto Phillies 1.5 Carson Kelly Cubs 1.5 Tyler Stephenson Reds 1.1 Worst Catchers In ABS Net Overturns (min. 20 challenges) Player Team Net Runs For William Contreras Brewers -3.8 Drew Millas Nationals -3.6 Edgar Quero White Sox -3.6 Outcome Flips Catchers can help out their pitchers by saving their challenges for important times in the count. Removing walks or adding strikeouts can not only improve a pitcher’s box score but also dramatically impact a team’s win probability and overall success in the game, depending on the situation. Since this is a counting metric, it would be unfair to highlight the fewest flips. Best Catchers In Outcome Flips (min. 20 challenges) Player Team Strikeouts Flipped Walks Flipped Shea Langeliers Athletics 20 8 Victor Caratini Twins 17 6 Hunter Goodman Rockies 17 4 Tyler Stephenson Reds 17 4 Reasonable Challenges According to Baseball Savant, a "reasonable" challenge opportunity occurs when at least one of the following is true: The original call was incorrect; the pitch is within 3 inches of the strike zone edge and an overturn would gain at least 0.3 runs; the pitch carries an expected challenge rate of at least 20%. Reasonable challenges would indicate if a player is choosing the correct pitches to challenge and not needlessly wasting them on low-probability decisions. A challenge classified as “unreasonable” would certainly result in a confirmed call. Catchers need to balance making sure that their challenges are reasonable when taken, and not missing out on challenges that could have been overturned. Best Catchers In Reasonable Challenges (min. 20 challenges) Player Team % Challenges Considered Reasonable % of Reasonable Challenge Opportunities Taken Mitch Garver Mariners 87% 27% Hunter Goodman Rockies 86% 35% Sandy Leon Braves 86% 38% Worst Catchers In Reasonable Challenges (min. 20 challenges) Player Team % Challenges Considered Reasonable % of Reasonable Challenge Opportunities Taken Drew Millas Nationals 49% 21% Brandon Valenzuela Blue Jays 50% 15% Johnny Pereda Mariners 50% 23% Verdict Which catchers stand out when combining all of these aspects? Best Overall ABS Catcher: Hunter Goodman - Rockies Goodman consistently ranked among the league leaders across nearly every metric. In the metrics where he fell outside of the top three, he ranks 13th at 67% (while having a larger sample size than all but one of the catchers ahead of him) and 4th in net runs with 0.9 runs. His strong decision-making and ability to reverse key outcomes led him to be one of MLB’s top performers in ABS challenges. Worst Overall ABS Catcher: Drew Millas - Nationals Millas is the only catcher who challenges fewer than half of the reasonable challenge opportunities. Despite having the 16th-most challenges (out of 62 catchers with at least 20 challenges), he only has four flipped calls. Only three catchers in this group have fewer flipped calls than he does. He has the second fewest net runs, but the leader Contreras has 60 more challenges than Millas, with only 0.2 fewer runs. Millas was also in the bottom five in both net turnovers and success rate. He will look to improve in these areas going into the second half of the season.
-
- 1
-

-
- hunter goodman
- drew millas
- (and 6 more)
-
Image courtesy of © Mike Lang / Sarasota Herald-Tribune / USA TODAY NETWORK via Imagn Images Major League Baseball is implementing the new Automated Ball-Strike (ABS) Challenge System starting in the 2026 season. The Statcast data from Baseball Savant provides several visualizations of the results of these challenges. There is surface-level data that offers interesting insights into which teams are most and least successful, as well as which players stand out the most. There is also detailed data that indicates behavioral aspects of challenging. These observations should come with an important caveat: spring training data may reflect players pressing to make Opening Day rosters. It will be interesting to compare how challenge behaviors change (if at all) once the regular season begins. ABS Challenge Rates Baseball Savant defines challenge rate as “the rate of challenges initiated out of potential challenges, defined as non-swings (takes) that a) came with at least one challenge available and b) resulted in calls that went against the challenging team (i.e., called strike for hitters and called ball for fielders).” Batters tend to challenge at a higher rate than catchers, and they are more likely to challenge in high-leverage situations. For instance, batters have an overall challenge rate of 4.8%, which jumps to 17% and 20% on two-strike and full counts, respectively. Throughout spring training, batters saw significant variation in challenge rates. Batter challenges peaked on March 3 with a seven-day rolling average of 6.3%. By March 24, that rolling average dropped to 4.0%. This could suggest hitters were still calibrating to the ABS strike zone early in camp. Catchers have a 2.3% challenge rate and have not been as sensitive to high-leverage counts. Their challenge rate did not meaningfully jump for two-strike counts, but increased to 4.1% and 5.5% for three-ball and full counts, respectively. Unlike hitters, catchers’ seven-day rolling average stayed relatively steady between 2.0% and 2.5% throughout March. ABS Challenge Success Rates The overall success rate of challenges is 53%, but the success rates for catchers and hitters differ significantly. Catchers succeed 60% of the time, compared to 46% for hitters. Both batters and catchers have overturn rates that diminish in these higher leverage counts. In full counts, success rates drop to around 43%. Either side in a loaded count stands to overturn a negative outcome and immediately flip the result. Changing a strikeout to a walk (or vice versa) can have a meaningful impact on the game state. Team Behaviors Not every team challenges at the same rate. The New York Yankees have an aggressive challenge strategy, leading the league on both sides of the plate. They have a 9.0% hitter challenge rate and a 4.5% catcher challenge rate. On the opposite end of the spectrum, the Arizona Diamondbacks have the lowest combined challenge rates, at 2.3% and 1.5% for catchers and hitters, respectively. Some teams favor one side of the plate. The Kansas City Royals batters challenge at 5.5% of the time (8th-highest), but as catchers, not as often at only 1.8% (7th-lowest). Conversely, the Atlanta Braves challenge often as catchers, at 2.9% of the time (4th-highest), and rarely as batters, at only 3.8% (7th-lowest). While the Yankees have the most challenges, they do not have the highest success rates. The Phillies have the highest success rate for batters at 52%, and the Cardinals have the highest success rate as catchers at 75%. The Diamondbacks have the lowest batter success rate at 33%, and the Dodgers have the lowest catcher success rate at 43%. Baseball Savant includes a chart that accounts for expected challenges based on pitch location, number of remaining challenges, runners on base, and the ball/strike/out situation. The Cardinals rate as the best team relative to expectation, with 12.8 more overturns than expected as catchers and 6.0 more overturns as hitters. Even though the Cardinals are near the middle of the pack in challenge rate, they have driven the most value from their challenges overall. The Mets were the worst team on defense, with 6.4 fewer overturns than expected, while the Nationals were the worst team batting with 7.6 fewer overturns than expected. When do teams issue their first challenge? It's no surprise that the Yankees are the quickest team to challenge. On average, they issue a first challenge around the 2nd or 3rd inning, and they are tied with the Chicago White Sox, who are not as aggressive in their challenges, but rank 9th and 5th for batters and catchers, respectively. The team that is most patient with their challenges this spring was the Baltimore Orioles, who, on average, wouldn’t challenge until the 4th or 5th inning in games where they issued one. When do teams usually run out of challenges? The Athletics ran out of challenges the soonest, around the 4th inning, in the six games they exhausted them. The Detroit Tigers only ran out of challenges three times, typically around the 8th or 9th inning. The Yankees ranked 14th in earliest depletion time at around the 6th inning. It should be no surprise that they ran out of challenges the most often, with 20 game occurrences. The Twins ran out of challenges 19 times and ranked second overall in challenge frequency. It is not a surprise that teams that challenge more often run out of challenges, but it is also noteworthy that those teams aren’t necessarily reckless, as they do not consistently lose those challenges early. ABS Challenge Takeaways It is clear that teams are implementing different challenge strategies throughout spring training as they get used to the ABS system. Will these trends continue into the regular season, or will teams maybe be more selective in their challenges when the games start to matter? Entering the regular season, it would be interesting to see if win-probability implications could be added to the ABS data to see which teams and players have impacted their teams’ win probabilities based on their challenge success. Reversing a walk or strikeout in key moments can materially swing game outcomes, and teams could potentially use this information to determine optimal challenge strategies. While the volume of challenges doesn't necessarily drive success, it will be important for teams to strike a balance between taking advantage of the challenges available to them and not losing their valuable challenges too early in the game. View full article
-
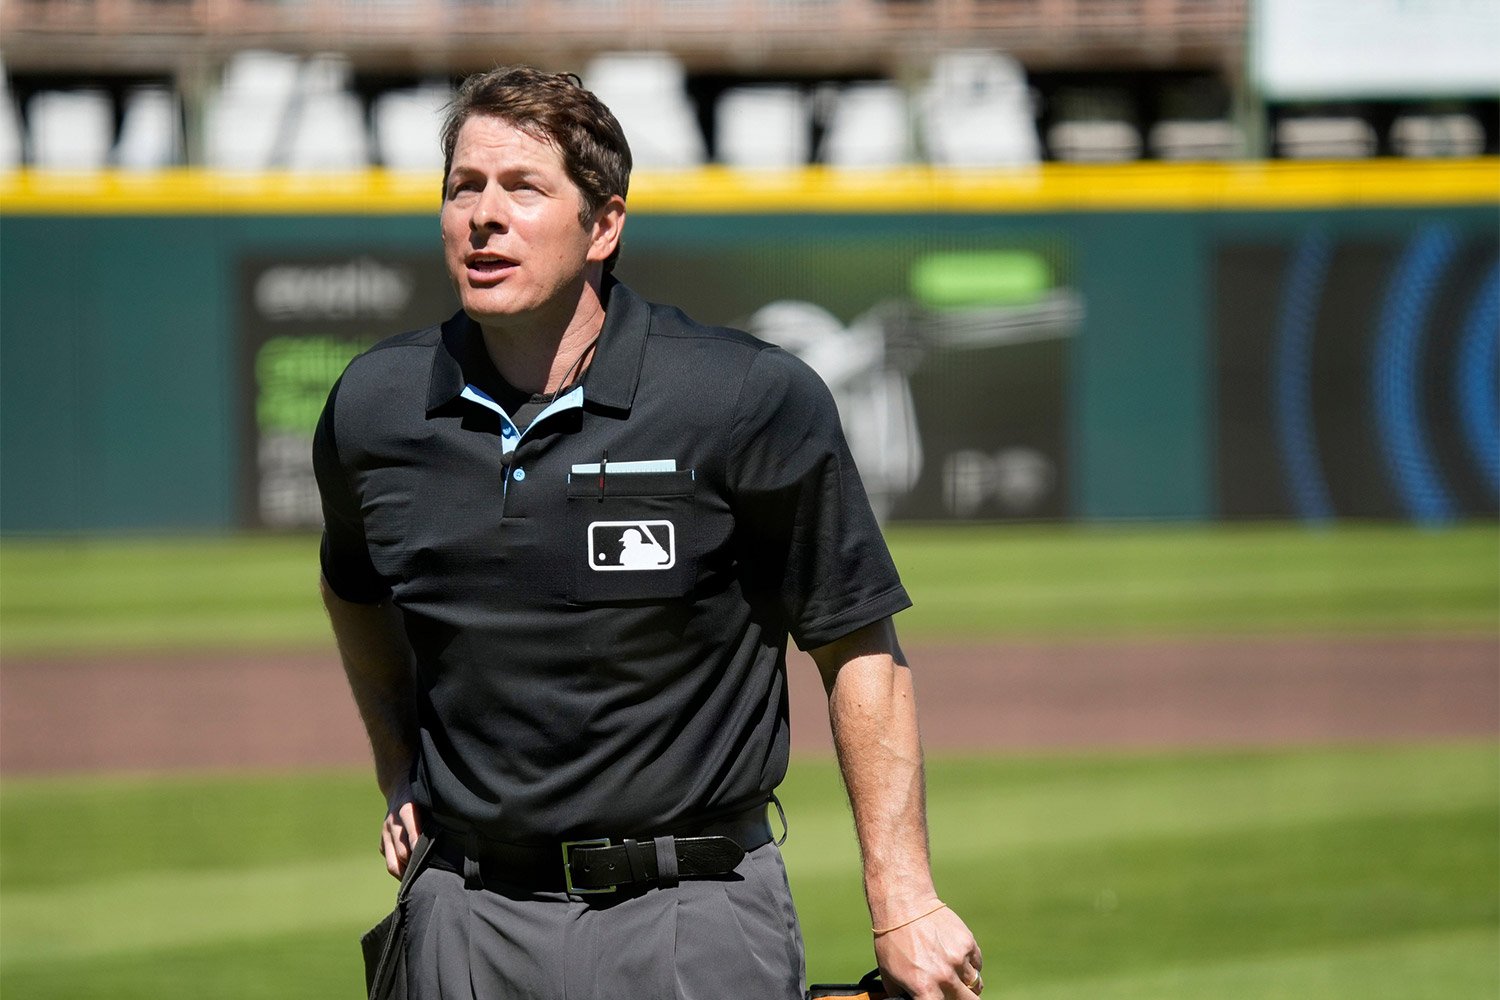 Major League Baseball is implementing the new Automated Ball-Strike (ABS) Challenge System starting in the 2026 season. The Statcast data from Baseball Savant provides several visualizations of the results of these challenges. There is surface-level data that offers interesting insights into which teams are most and least successful, as well as which players stand out the most. There is also detailed data that indicates behavioral aspects of challenging. These observations should come with an important caveat: spring training data may reflect players pressing to make Opening Day rosters. It will be interesting to compare how challenge behaviors change (if at all) once the regular season begins. ABS Challenge Rates Baseball Savant defines challenge rate as “the rate of challenges initiated out of potential challenges, defined as non-swings (takes) that a) came with at least one challenge available and b) resulted in calls that went against the challenging team (i.e., called strike for hitters and called ball for fielders).” Batters tend to challenge at a higher rate than catchers, and they are more likely to challenge in high-leverage situations. For instance, batters have an overall challenge rate of 4.8%, which jumps to 17% and 20% on two-strike and full counts, respectively. Throughout spring training, batters saw significant variation in challenge rates. Batter challenges peaked on March 3 with a seven-day rolling average of 6.3%. By March 24, that rolling average dropped to 4.0%. This could suggest hitters were still calibrating to the ABS strike zone early in camp. Catchers have a 2.3% challenge rate and have not been as sensitive to high-leverage counts. Their challenge rate did not meaningfully jump for two-strike counts, but increased to 4.1% and 5.5% for three-ball and full counts, respectively. Unlike hitters, catchers’ seven-day rolling average stayed relatively steady between 2.0% and 2.5% throughout March. ABS Challenge Success Rates The overall success rate of challenges is 53%, but the success rates for catchers and hitters differ significantly. Catchers succeed 60% of the time, compared to 46% for hitters. Both batters and catchers have overturn rates that diminish in these higher leverage counts. In full counts, success rates drop to around 43%. Either side in a loaded count stands to overturn a negative outcome and immediately flip the result. Changing a strikeout to a walk (or vice versa) can have a meaningful impact on the game state. Team Behaviors Not every team challenges at the same rate. The New York Yankees have an aggressive challenge strategy, leading the league on both sides of the plate. They have a 9.0% hitter challenge rate and a 4.5% catcher challenge rate. On the opposite end of the spectrum, the Arizona Diamondbacks have the lowest combined challenge rates, at 2.3% and 1.5% for catchers and hitters, respectively. Some teams favor one side of the plate. The Kansas City Royals batters challenge at 5.5% of the time (8th-highest), but as catchers, not as often at only 1.8% (7th-lowest). Conversely, the Atlanta Braves challenge often as catchers, at 2.9% of the time (4th-highest), and rarely as batters, at only 3.8% (7th-lowest). While the Yankees have the most challenges, they do not have the highest success rates. The Phillies have the highest success rate for batters at 52%, and the Cardinals have the highest success rate as catchers at 75%. The Diamondbacks have the lowest batter success rate at 33%, and the Dodgers have the lowest catcher success rate at 43%. Baseball Savant includes a chart that accounts for expected challenges based on pitch location, number of remaining challenges, runners on base, and the ball/strike/out situation. The Cardinals rate as the best team relative to expectation, with 12.8 more overturns than expected as catchers and 6.0 more overturns as hitters. Even though the Cardinals are near the middle of the pack in challenge rate, they have driven the most value from their challenges overall. The Mets were the worst team on defense, with 6.4 fewer overturns than expected, while the Nationals were the worst team batting with 7.6 fewer overturns than expected. When do teams issue their first challenge? It's no surprise that the Yankees are the quickest team to challenge. On average, they issue a first challenge around the 2nd or 3rd inning, and they are tied with the Chicago White Sox, who are not as aggressive in their challenges, but rank 9th and 5th for batters and catchers, respectively. The team that is most patient with their challenges this spring was the Baltimore Orioles, who, on average, wouldn’t challenge until the 4th or 5th inning in games where they issued one. When do teams usually run out of challenges? The Athletics ran out of challenges the soonest, around the 4th inning, in the six games they exhausted them. The Detroit Tigers only ran out of challenges three times, typically around the 8th or 9th inning. The Yankees ranked 14th in earliest depletion time at around the 6th inning. It should be no surprise that they ran out of challenges the most often, with 20 game occurrences. The Twins ran out of challenges 19 times and ranked second overall in challenge frequency. It is not a surprise that teams that challenge more often run out of challenges, but it is also noteworthy that those teams aren’t necessarily reckless, as they do not consistently lose those challenges early. ABS Challenge Takeaways It is clear that teams are implementing different challenge strategies throughout spring training as they get used to the ABS system. Will these trends continue into the regular season, or will teams maybe be more selective in their challenges when the games start to matter? Entering the regular season, it would be interesting to see if win-probability implications could be added to the ABS data to see which teams and players have impacted their teams’ win probabilities based on their challenge success. Reversing a walk or strikeout in key moments can materially swing game outcomes, and teams could potentially use this information to determine optimal challenge strategies. While the volume of challenges doesn't necessarily drive success, it will be important for teams to strike a balance between taking advantage of the challenges available to them and not losing their valuable challenges too early in the game.
