
-
Posts
4 -
Joined
-
Last visited
Content Type
Profiles
Forums
Events
News
Tutorials & Help
Major League Baseball Videos
Guides & Resources
Store
Downloads
Gallery
Everything posted by Jeremy Tecktiel
-
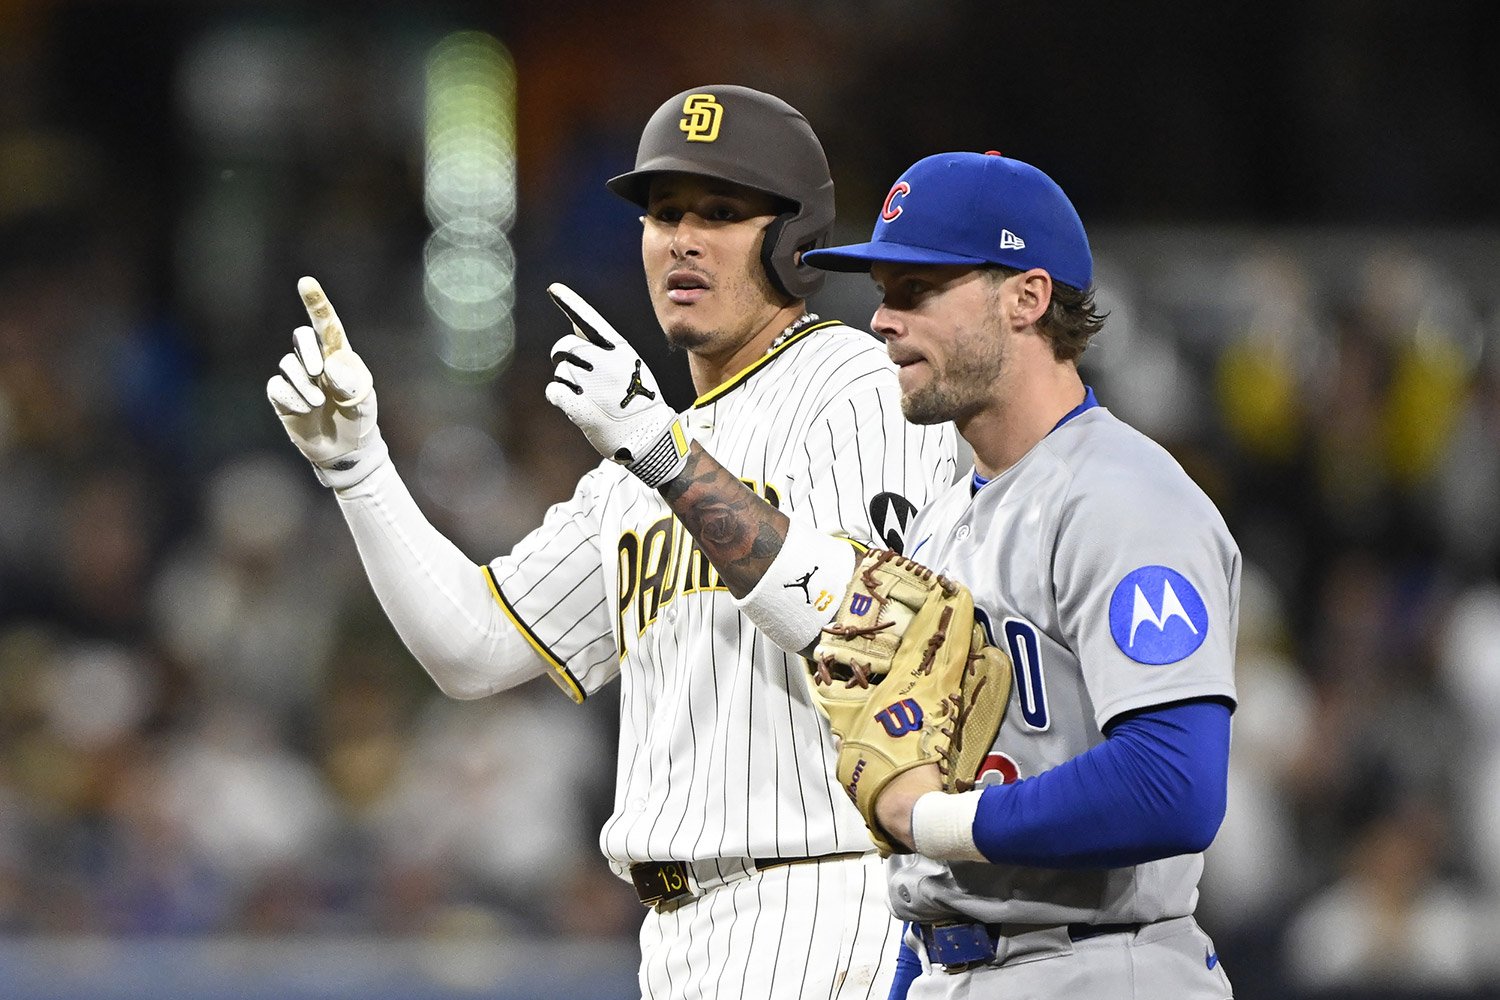
 Image courtesy of © Denis Poroy-Imagn Images Baseball is really hard. Everyone who has played or watched some level of baseball has heard that even the greatest players failed 7 times out of 10. While a massive oversimplification, this has come to be a rallying cry of sorts, used by, for lack of a better term, failures. You never hear this after a positive event; it always follows some sort of negative event and is meant to put an emphasis on how difficult baseball is. So we know that in baseball, you’ll fail a lot. Failure, in itself, really is not all that enjoyable. Most people try to avoid failure. They prepare; their process is good, and they control everything they can. And yet, failure still comes frequently. It is why you constantly hear players talk about the process and not the results; they talk about controlling what they can. If process is so important, shouldn’t credit be given for good process? In the previous article, I explained what wOBA is and why it is such a useful metric. In this article, we will take it one step further. We will add letters and make acronyms that are even more fun to say! In baseball metrics, x simply stands for expected. So while wOBA explains the results, xwOBA sheds more light on the process. Each batted ball has an exit velocity and a launch angle, no matter how much a certain FOX announcer complains. Using the combination of how hard the ball was hit (exit velocity) and whether it was hit in the air or on the ground (launch angle) tells us how likely a ball was to be a hit, regardless of the result. The harder a ball is hit, the more difficult it is for the defense to make the play. Line drives are harder for a defense to make a play on than groundballs and fly balls. Makes sense! With this information, it seems obvious that hitters want to try to hit line drives as hard as they can. We should find a way to reward them for that! This is what xwOBA does. So why is xwOBA valuable then? Because life is not fair. Sometimes, hitters hit a 110 mph line drive (good process!), and it gets caught (bad result!). Sometimes, hitters hit a ball 70 mph while breaking their bat (bad process!) and wind up on 2nd base (good result!). If we want to focus on the process and control what we can, xwOBA is the way. Luck always plays an outsized role in baseball, and xwOBA is just one way to look at luck’s impact. Once the ball leaves a pitcher’s hand or the hitter’s bat, he has no control over what happens next. Batting average on balls in play (BABIP) has generally been used to measure luck. It removes strikeouts, walks, and home runs. Removing the “three true outcomes” that don’t involve the defense tells you how often the defense made the play. A player with a BABIP significantly over .300 was considered lucky, whereas one significantly lower was unlucky. In the same way we can get more accurate OPS with wOBA, you can get a more accurate version of BABIP with wOBAcon, or weighted on base on contact. Plus, you get to think of bacon. Win-win! wOBAcon tells you how much value a hitter provided when he put the ball in play. A relative of BABIP, wOBAcon does two huge things differently. First, it includes the value of every batted ball in each situation, not just whether it was a hit or not, similar to wOBA. Secondly, it does not exclude home runs as BABIP does. This is good! Just because it goes over the fence doesn’t mean the ball wasn’t put in play. The best players in baseball will run a wOBAcon near or over .500, similar to slugging percentage. xwOBAcon has the same relationship to wOBAcon as xwOBA does to wOBA. It focuses on the inputs and not the outputs, so as to give a process-based number instead of focusing solely on results. View full article
 -
 Baseball is really hard. Everyone who has played or watched some level of baseball has heard that even the greatest players failed 7 times out of 10. While a massive oversimplification, this has come to be a rallying cry of sorts, used by, for lack of a better term, failures. You never hear this after a positive event; it always follows some sort of negative event and is meant to put an emphasis on how difficult baseball is. So we know that in baseball, you’ll fail a lot. Failure, in itself, really is not all that enjoyable. Most people try to avoid failure. They prepare; their process is good, and they control everything they can. And yet, failure still comes frequently. It is why you constantly hear players talk about the process and not the results; they talk about controlling what they can. If process is so important, shouldn’t credit be given for good process? In the previous article, I explained what wOBA is and why it is such a useful metric. In this article, we will take it one step further. We will add letters and make acronyms that are even more fun to say! In baseball metrics, x simply stands for expected. So while wOBA explains the results, xwOBA sheds more light on the process. Each batted ball has an exit velocity and a launch angle, no matter how much a certain FOX announcer complains. Using the combination of how hard the ball was hit (exit velocity) and whether it was hit in the air or on the ground (launch angle) tells us how likely a ball was to be a hit, regardless of the result. The harder a ball is hit, the more difficult it is for the defense to make the play. Line drives are harder for a defense to make a play on than groundballs and fly balls. Makes sense! With this information, it seems obvious that hitters want to try to hit line drives as hard as they can. We should find a way to reward them for that! This is what xwOBA does. So why is xwOBA valuable then? Because life is not fair. Sometimes, hitters hit a 110 mph line drive (good process!), and it gets caught (bad result!). Sometimes, hitters hit a ball 70 mph while breaking their bat (bad process!) and wind up on 2nd base (good result!). If we want to focus on the process and control what we can, xwOBA is the way. Luck always plays an outsized role in baseball, and xwOBA is just one way to look at luck’s impact. Once the ball leaves a pitcher’s hand or the hitter’s bat, he has no control over what happens next. Batting average on balls in play (BABIP) has generally been used to measure luck. It removes strikeouts, walks, and home runs. Removing the “three true outcomes” that don’t involve the defense tells you how often the defense made the play. A player with a BABIP significantly over .300 was considered lucky, whereas one significantly lower was unlucky. In the same way we can get more accurate OPS with wOBA, you can get a more accurate version of BABIP with wOBAcon, or weighted on base on contact. Plus, you get to think of bacon. Win-win! wOBAcon tells you how much value a hitter provided when he put the ball in play. A relative of BABIP, wOBAcon does two huge things differently. First, it includes the value of every batted ball in each situation, not just whether it was a hit or not, similar to wOBA. Secondly, it does not exclude home runs as BABIP does. This is good! Just because it goes over the fence doesn’t mean the ball wasn’t put in play. The best players in baseball will run a wOBAcon near or over .500, similar to slugging percentage. xwOBAcon has the same relationship to wOBAcon as xwOBA does to wOBA. It focuses on the inputs and not the outputs, so as to give a process-based number instead of focusing solely on results.
 -
Baseball Smarter: What Is wOBA, And Why Is It So Fun To Say Out Loud?
Jeremy Tecktiel posted an article in MLB
 Baseball is rife with numbers and statistics, and, despite what some around the game may say, has been for over a hundred years. Over time, thanks to scores of baseball nerds, the statistics have gotten better, more descriptive. All of the acronyms can be dizzying; they can cause even the most analytically friendly of eyes to glaze over. Listening to someone talk about new metrics can be like entering an 8th-grade classroom and trying to understand the slang that is being used. Are they even speaking the same language as me? When did I become old? No one wants to face those questions! They are often accompanied by a feeling of fear and defensiveness. If engaging in something you have loved for your whole life forces you to constantly face these questions, the natural reaction is to push back. The eternal nerds vs. jocks arguments stem from this. To put this argument simply, both sides agree that scoring and preventing runs win baseball games. Great, problem solved! Everything else is just a case study in what language people use to try to prove they are right. At their core, these metrics and what they explain are nothing new to the game of baseball. No reasonable person can argue that a single and a home run are equally as good (sorry, not-sorry, A-Rod). Can you picture a little league game where a kid crushes a ball over the outfielders' heads and then stops at first because singles are cool? Great, me neither. That means we are officially on the same page with regard to batting average not being quite enough. I like to think of batting average as sports broadcasts from the 1990s. Sure, you get a general sense of what is going on, but you have to squint, and everything is hazy, and you are left wondering how we ever watched sports that way and thought it was good enough. Adding slugging percentage and on-base percentage, the traditional slash line gets you to the early 2000’s with the advent of HD. Clearly better but still lacking, we need more cameras and more angles! This is what wOBA, or weighted on-base percentage, brings to the table. A full suite of cameras and angles to help see with more clarity. On-base percentage assumes that a walk is also equal to a home run, which I think we can all agree is not true. So how much is a walk really worth? Or a single, double, triple, or home run, for that matter? What about a single to lead off an inning; that has to be more valuable than a single with 2 outs and the bases empty, right? This is where the “weighted” part of wOBA comes into play. There are 24 possible situations that a hitter can come to the plate with: Bases Empty (0, 1, or 2 outs) Runner on 1st (0, 1, or 2 outs) Runner on 2nd (0, 1, or 2 outs) Runner on 3rd (0, 1, or 2 outs) Runners on 1st and 2nd (0, 1, or 2 outs) Runners on 1st and 3rd (0, 1, or 2 outs) Runners on 2nd and 3rd (0, 1, or 2 outs) Bases Loaded (0, 1, or 2 outs) A walk or a hit in each of these scenarios has different probabilities of leading to a run, which is still the whole point of baseball! wOBA takes the result of each at-bat in each scenario and attributes value to it that is more telling than “hit good, out bad.” Again, no one should argue with this! A bases-loaded double obviously does more to help a team score runs than a double with the bases empty. OPS condenses the slash line by combining on-base percentage and slugging percentage and has been pretty widely adopted; you can see it both on TV and at the ballpark with a much higher frequency than in the past. wOBA aims to do essentially what OPS does, it just does it more accurately. While the math and specific weights can be confusing, the idea of wOBA shouldn’t be. When the rubber hits the road, though, what does the wOBA number next to a player's name actually represent? Here's a handy chart for reference: wOBA Ranges Elite - .400+ Excellent - .360 to .400 Above Average - .345 to .360 Average - .332 to .345 Below Average - .315 to .332 Poor - Below .320 2025 MLB League Leaders Aaron Judge - .463 Shohei Ohtani - .418 George Springer - .408 Cal Raleigh - .392 Kyle Schwarber - .391 Juan Soto - .390
 -
Image courtesy of © John Froschauer-Imagn Images Baseball is rife with numbers and statistics, and, despite what some around the game may say, has been for over a hundred years. Over time, thanks to scores of baseball nerds, the statistics have gotten better, more descriptive. All of the acronyms can be dizzying; they can cause even the most analytically friendly of eyes to glaze over. Listening to someone talk about new metrics can be like entering an 8th-grade classroom and trying to understand the slang that is being used. Are they even speaking the same language as me? When did I become old? No one wants to face those questions! They are often accompanied by a feeling of fear and defensiveness. If engaging in something you have loved for your whole life forces you to constantly face these questions, the natural reaction is to push back. The eternal nerds vs. jocks arguments stem from this. To put this argument simply, both sides agree that scoring and preventing runs win baseball games. Great, problem solved! Everything else is just a case study in what language people use to try to prove they are right. At their core, these metrics and what they explain are nothing new to the game of baseball. No reasonable person can argue that a single and a home run are equally as good (sorry, not-sorry, A-Rod). Can you picture a little league game where a kid crushes a ball over the outfielders' heads and then stops at first because singles are cool? Great, me neither. That means we are officially on the same page with regard to batting average not being quite enough. I like to think of batting average as sports broadcasts from the 1990s. Sure, you get a general sense of what is going on, but you have to squint, and everything is hazy, and you are left wondering how we ever watched sports that way and thought it was good enough. Adding slugging percentage and on-base percentage, the traditional slash line gets you to the early 2000’s with the advent of HD. Clearly better but still lacking, we need more cameras and more angles! This is what wOBA, or weighted on-base percentage, brings to the table. A full suite of cameras and angles to help see with more clarity. On-base percentage assumes that a walk is also equal to a home run, which I think we can all agree is not true. So how much is a walk really worth? Or a single, double, triple, or home run, for that matter? What about a single to lead off an inning; that has to be more valuable than a single with 2 outs and the bases empty, right? This is where the “weighted” part of wOBA comes into play. There are 24 possible situations that a hitter can come to the plate with: Bases Empty (0, 1, or 2 outs) Runner on 1st (0, 1, or 2 outs) Runner on 2nd (0, 1, or 2 outs) Runner on 3rd (0, 1, or 2 outs) Runners on 1st and 2nd (0, 1, or 2 outs) Runners on 1st and 3rd (0, 1, or 2 outs) Runners on 2nd and 3rd (0, 1, or 2 outs) Bases Loaded (0, 1, or 2 outs) A walk or a hit in each of these scenarios has different probabilities of leading to a run, which is still the whole point of baseball! wOBA takes the result of each at-bat in each scenario and attributes value to it that is more telling than “hit good, out bad.” Again, no one should argue with this! A bases-loaded double obviously does more to help a team score runs than a double with the bases empty. OPS condenses the slash line by combining on-base percentage and slugging percentage and has been pretty widely adopted; you can see it both on TV and at the ballpark with a much higher frequency than in the past. wOBA aims to do essentially what OPS does, it just does it more accurately. While the math and specific weights can be confusing, the idea of wOBA shouldn’t be. When the rubber hits the road, though, what does the wOBA number next to a player's name actually represent? Here's a handy chart for reference: wOBA Ranges Elite - .400+ Excellent - .360 to .400 Above Average - .345 to .360 Average - .332 to .345 Below Average - .315 to .332 Poor - Below .320 2025 MLB League Leaders Aaron Judge - .463 Shohei Ohtani - .418 George Springer - .408 Cal Raleigh - .392 Kyle Schwarber - .391 Juan Soto - .390 View full article

