

Cody Christie
-
Posts
55 -
Joined
-
Last visited
-
Days Won
5
Content Type
Profiles
Forums
Events
News
Tutorials & Help
Major League Baseball Videos
Guides & Resources
Store
Downloads
Gallery
Everything posted by Cody Christie
-
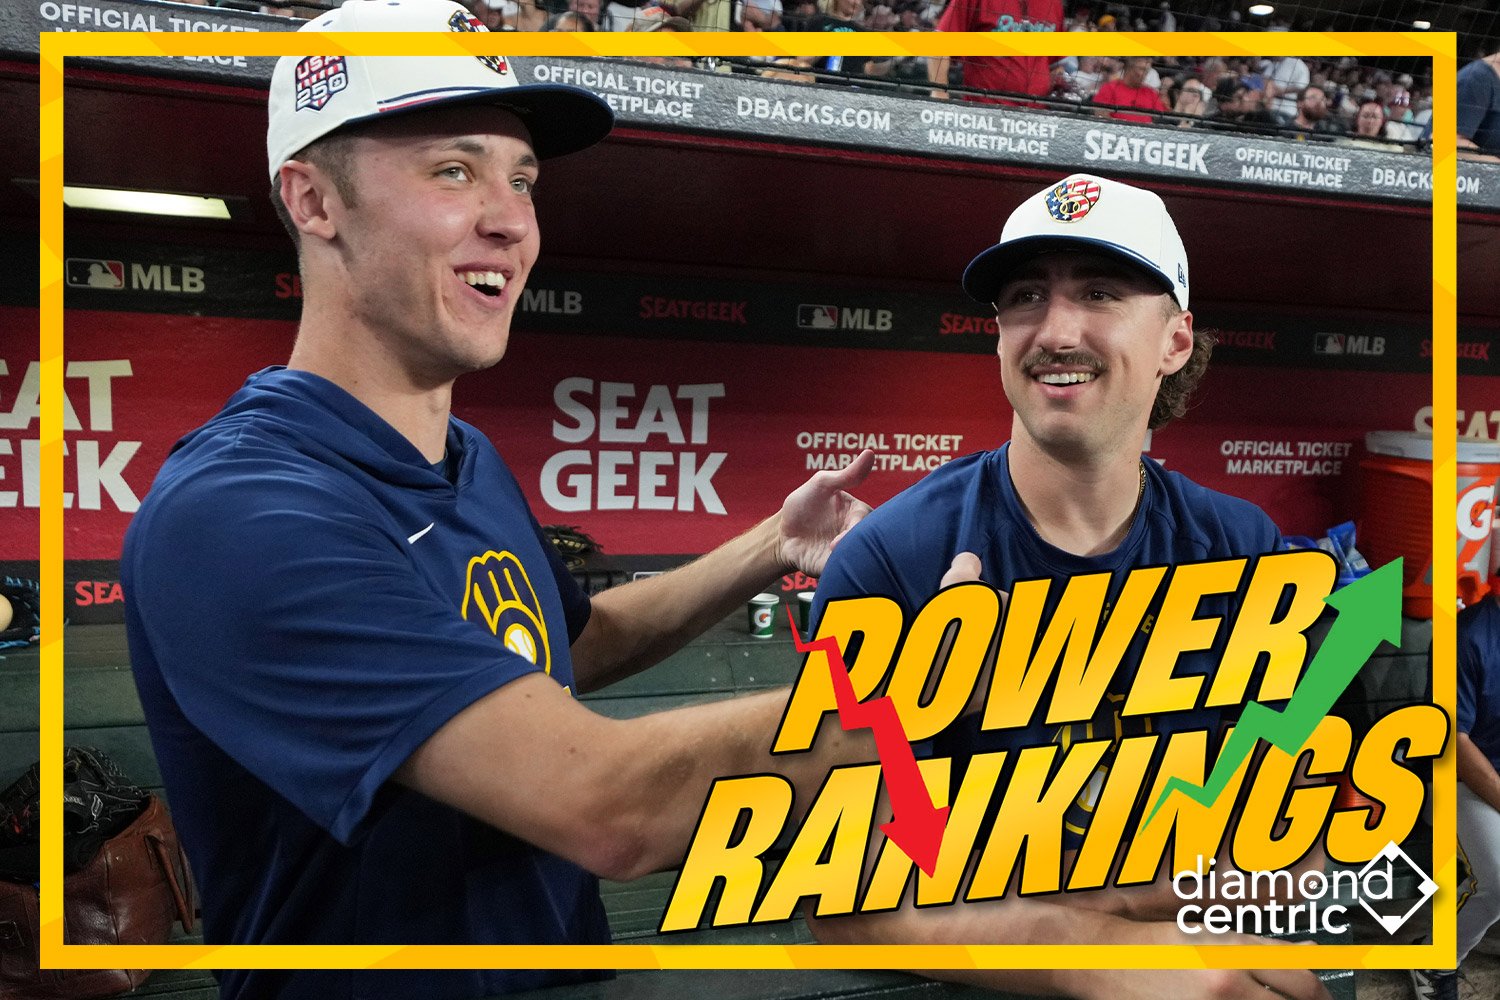
 Image courtesy of © Rick Scuteri-Imagn Images With the All-Star break arriving next week, Major League Baseball is approaching a natural reset point. Players and coaches will get a few days to recharge, but front offices will quickly shift into one of the busiest stretches of the season. Once play resumes, clubs will have roughly three weeks to determine whether they are buyers, sellers, or somewhere in between before the MLB Trade Deadline reshapes pennant races across the league. That is why third-order wins remain one of the best tools for evaluating team performance. Based on Clay Davenport's adjusted standings, the metric looks beyond a team's record by incorporating run differential, strength of schedule, and ballpark effects. It provides a clearer picture of which clubs are playing the best baseball and which may be benefiting from favorable sequencing or circumstances. These rankings are designed to highlight sustainable performance rather than short-term momentum. The arrows below show which teams are trending upward, slipping backward, or holding steady as the race toward October enters its most consequential stretch. 1. Dodgers — 61.0–28.9 (.679) Biggest Weekly Storyline: Shohei Ohtani is unlikely to pitch in MLB All-Star Game with Dodgers' pitching rotation shuffle. On his current rotation, Ohtani would only have three days of rest before the July 14 All-Star Game. 2. Brewers — 54.7–32.3 (.629) ⬆️ Biggest Weekly Storyline: Brewers ace Jacob Misiorowski's four-seamer leads all pitches in run value this season at +19. At 100.4 mph with a 43 percent whiff rate and a .245 wOBA allowed on 987 throws, hitters have no answer for it. 3. Yankees — 52.2–35.8 (.593) ⬇️ Biggest Weekly Storyline: The Yankees snapped a seven-game losing streak on Friday. It was their longest of the season and their worst since they endured a nine-game skid in August 2023. 4. Rays — 49.0–37.0 (.570) ⬆️ Biggest Weekly Storyline: Rays star Junior Caminero became the youngest player since at least 1900 to hit a home run in 6 straight games. 5. Marlins — 50.9–39.0 (.566) Biggest Weekly Storyline: shortstop Otto Lopez broke Miguel Cabrera’s season record with his 37th multi-hit game of the season. Pretty remarkable since it’s not even the All-Star break. 6. Pirates — 50.8–39.2 (.564) ⬇️ Biggest Weekly Storyline: Braxton Ashcraft won his fourth consecutive start after allowing one run on six hits in 5 2/3 innings and striking out seven. The right-hander has a 3.04 ERA and 32 strikeouts in four starts since June 17 and has won eight of his past nine decisions. 7. Braves — 48.1–38.9 (.553) Biggest Weekly Storyline: On June 1, the Braves had a 9.5-game lead in the NL East. After a 9-14 month, Atlanta’s lead was trimmed to just 2.5 games. 8. Cubs — 48.0–41.0 (.539) Biggest Weekly Storyline: The Cubs became the first team since 1894 to win and lose back-to-back games by at least 15 runs. On Wednesday, Chicago beat San Diego 23-3 and then lost on Friday 17-1 to St. Louis. 9. Mariners — 47.1–42.9 (.523) Biggest Weekly Storyline: Mariners outfielder Julio Rodríguez went on 7-day concussion injured list after taking a throw to the back of helmet. He was hit during an attempted double-play in the first inning Thursday and eventually left the game. 10. Tigers — 46.1–42.9 (.518) ⬆️ Biggest Weekly Storyline: Despite a disappointing season, ESPN has two Tigers players, Kevin McGonigle and Dillon Dingler, in the top-five of their AL MVP voting. 11. Rangers — 45.4–43.6 (.510) Biggest Weekly Storyline: Texas lost a pair of veteran relievers with Jakob Junis going on the injured list due to a hip impingement. In addition, the Rangers announced that Jalen Beeks has a strained flexor tendon in his elbow and will undergo season-ending surgery. 12. Red Sox — 44.1–42.9 (.507) Biggest Weekly Storyline: Aroldis Chapman broke the MLB all-time strikeout record among relievers with career strikeout No. 1,364. 13. White Sox — 44.4–43.6 (.505) ⬇️ Biggest Weekly Storyline: White Sox's star rookie Munetaka Murakami began a baserunning progression after 29 games out. He has been out since May 29th with a Grade 2 hamstring strain. 14. Cardinals — 43.4–42.6 (.505) ⬆️ Biggest Weekly Storyline: Starter Dustin May was hit by a comebacker that hit his right foot and then ricocheted all the way to right field. X-rays were negative on the injury, but May said the ankle area was sore. 15. Nationals — 44.9–45.1 (.499) ⬆️ Biggest Weekly Storyline: Major League Baseball has handed out seven-game suspensions to both Red Sox Willson Contreras and Nationals Cade Cavalli after their benches-clearing incident on Tuesday. Nationals pitcher Miles Mikolas was also suspended five games, and Red Sox outfielder Nate Eaton got three games. 16. Blue Jays — 43.0–46.1 (.483) ⬇️ Biggest Weekly Storyline: First baseman Vladimir Guerrero Jr. was voted an All-Star starter despite having a career-worst season. However, he plans to sit out the game as he has dealt with a back issue. 17. Guardians — 43.5–46.5 (.483) Biggest Weekly Storyline: The Guardians took the first two games of their pivotal White Sox series in walk-off fashion. Brayan Rocchio hit a walk-off homer on Thursday before Kahlil Watson singled in the 10th inning on Friday. 18. Phillies — 42.9–46.1 (.482) ⬆️ Biggest Weekly Storyline: The Phillies are hosting the 2026 All-Star Game and tied for the most representatives. Brandon Marsh, Bryce Harper, Kyle Schwarber, Cristopher Sanchez, and Jhoan Duran were announced on Saturday. 19. Giants — 42.2–45.8 (.480) Biggest Weekly Storyline: The Giants placed reliever Matt Gage on IL with elbow strain after 51-pitch relief appearance. Before Friday night, the lefty reliever's previous career high was 41 pitches thrown last July 21. 20. Orioles — 42.8–47.2 (.476) ⬇️ Biggest Weekly Storyline: Closer Ryan Helsley was placed on the injured list with right elbow discomfort. He was on the IL from May 1 to June 16 with right elbow inflammation. 21. Twins — 41.8–48.3 (.464) ⬆️ Biggest Weekly Storyline: On Sunday, Joe Ryan pitched seven shutout innings to help the Twins win a series in the Bronx for the first time since 2014. 22. Angels — 40.9–49.1 (.454) ⬇️ Biggest Weekly Storyline: Outfielder Mike Trout is hoping to return from injury for Angels next week ahead of the All-Star Game. Trout has been out since June 17, when he strained his right hamstring while running the bases against Arizona. 23. Diamondbacks — 39.7–48.4 (.451) Biggest Weekly Storyline: Reliever Ryan Thompson bounced a throw home in extra-innings that allowed an extra runner to score. He took responsibility after the game but it was a tough play no matter the outcome. 24. Astros — 40.8–50.2 (.448) ⬆️ Biggest Weekly Storyline: Starter Cristian Javier was reinstated from the 60-day injured list on Friday. A Grade 2 right shoulder strain has kept him out since April. 25. Padres — 39.4–48.6 (.448) ⬆️ Biggest Weekly Storyline: The Padres are the second team in MLB history to have a 6-game span with an 0-6 record, 75+ hits allowed, 60+ runs allowed, 30+ walks allowed, 15+ HR allowed. The other was the Phillies from June 19-22, 1929. 26. Mets — 39.5–49.5 (.444) ⬇️ Biggest Weekly Storyline: Juan Soto made headlines this week when asked about his relationship with Francisco Lindor from last year to this year. He said " When you meet a girl, you don’t start kissing her right away.” 27. Athletics — 37.6–51.4 (.422) Biggest Weekly Storyline: Former All-Star Brent Rooker will undergo season-ending knee surgery. It will take place during the All-Star break and address a cartilage tear in his left knee. 28. Royals — 36.8–52.2 (.414) ⬇️ Biggest Weekly Storyline: Shortstop Bobby Witt Jr. was named an All-Star starter for the first time in his career. He will be joined by Michael Wacha, who is making his second All-Star selection 11 years after his first. 29. Reds — 35.6–52.4 (.405) Biggest Weekly Storyline: Starter Hunter Greene returned to Cincinnati's rotation on Saturday. He allowed eight earned runs on seven hits and failed to make it out of the fourth frame. 30. Rockies — 35.4–54.6 (.393) Biggest Weekly Storyline: First baseman TJ Rumfield was selected as the NL’s Rookie of the Month for the second straight month. In June, he led all qualified National League rookies in average, on-base percentage, slugging percentage, doubles (9), extra-base hits (15) and total bases (56). What storylines stood out this week? Do you agree with the rankings above? Leave a comment and start the discussion. View full article
 -
 With the All-Star break arriving next week, Major League Baseball is approaching a natural reset point. Players and coaches will get a few days to recharge, but front offices will quickly shift into one of the busiest stretches of the season. Once play resumes, clubs will have roughly three weeks to determine whether they are buyers, sellers, or somewhere in between before the MLB Trade Deadline reshapes pennant races across the league. That is why third-order wins remain one of the best tools for evaluating team performance. Based on Clay Davenport's adjusted standings, the metric looks beyond a team's record by incorporating run differential, strength of schedule, and ballpark effects. It provides a clearer picture of which clubs are playing the best baseball and which may be benefiting from favorable sequencing or circumstances. These rankings are designed to highlight sustainable performance rather than short-term momentum. The arrows below show which teams are trending upward, slipping backward, or holding steady as the race toward October enters its most consequential stretch. 1. Dodgers — 61.0–28.9 (.679) Biggest Weekly Storyline: Shohei Ohtani is unlikely to pitch in MLB All-Star Game with Dodgers' pitching rotation shuffle. On his current rotation, Ohtani would only have three days of rest before the July 14 All-Star Game. 2. Brewers — 54.7–32.3 (.629) ⬆️ Biggest Weekly Storyline: Brewers ace Jacob Misiorowski's four-seamer leads all pitches in run value this season at +19. At 100.4 mph with a 43 percent whiff rate and a .245 wOBA allowed on 987 throws, hitters have no answer for it. 3. Yankees — 52.2–35.8 (.593) ⬇️ Biggest Weekly Storyline: The Yankees snapped a seven-game losing streak on Friday. It was their longest of the season and their worst since they endured a nine-game skid in August 2023. 4. Rays — 49.0–37.0 (.570) ⬆️ Biggest Weekly Storyline: Rays star Junior Caminero became the youngest player since at least 1900 to hit a home run in 6 straight games. 5. Marlins — 50.9–39.0 (.566) Biggest Weekly Storyline: shortstop Otto Lopez broke Miguel Cabrera’s season record with his 37th multi-hit game of the season. Pretty remarkable since it’s not even the All-Star break. 6. Pirates — 50.8–39.2 (.564) ⬇️ Biggest Weekly Storyline: Braxton Ashcraft won his fourth consecutive start after allowing one run on six hits in 5 2/3 innings and striking out seven. The right-hander has a 3.04 ERA and 32 strikeouts in four starts since June 17 and has won eight of his past nine decisions. 7. Braves — 48.1–38.9 (.553) Biggest Weekly Storyline: On June 1, the Braves had a 9.5-game lead in the NL East. After a 9-14 month, Atlanta’s lead was trimmed to just 2.5 games. 8. Cubs — 48.0–41.0 (.539) Biggest Weekly Storyline: The Cubs became the first team since 1894 to win and lose back-to-back games by at least 15 runs. On Wednesday, Chicago beat San Diego 23-3 and then lost on Friday 17-1 to St. Louis. 9. Mariners — 47.1–42.9 (.523) Biggest Weekly Storyline: Mariners outfielder Julio Rodríguez went on 7-day concussion injured list after taking a throw to the back of helmet. He was hit during an attempted double-play in the first inning Thursday and eventually left the game. 10. Tigers — 46.1–42.9 (.518) ⬆️ Biggest Weekly Storyline: Despite a disappointing season, ESPN has two Tigers players, Kevin McGonigle and Dillon Dingler, in the top-five of their AL MVP voting. 11. Rangers — 45.4–43.6 (.510) Biggest Weekly Storyline: Texas lost a pair of veteran relievers with Jakob Junis going on the injured list due to a hip impingement. In addition, the Rangers announced that Jalen Beeks has a strained flexor tendon in his elbow and will undergo season-ending surgery. 12. Red Sox — 44.1–42.9 (.507) Biggest Weekly Storyline: Aroldis Chapman broke the MLB all-time strikeout record among relievers with career strikeout No. 1,364. 13. White Sox — 44.4–43.6 (.505) ⬇️ Biggest Weekly Storyline: White Sox's star rookie Munetaka Murakami began a baserunning progression after 29 games out. He has been out since May 29th with a Grade 2 hamstring strain. 14. Cardinals — 43.4–42.6 (.505) ⬆️ Biggest Weekly Storyline: Starter Dustin May was hit by a comebacker that hit his right foot and then ricocheted all the way to right field. X-rays were negative on the injury, but May said the ankle area was sore. 15. Nationals — 44.9–45.1 (.499) ⬆️ Biggest Weekly Storyline: Major League Baseball has handed out seven-game suspensions to both Red Sox Willson Contreras and Nationals Cade Cavalli after their benches-clearing incident on Tuesday. Nationals pitcher Miles Mikolas was also suspended five games, and Red Sox outfielder Nate Eaton got three games. 16. Blue Jays — 43.0–46.1 (.483) ⬇️ Biggest Weekly Storyline: First baseman Vladimir Guerrero Jr. was voted an All-Star starter despite having a career-worst season. However, he plans to sit out the game as he has dealt with a back issue. 17. Guardians — 43.5–46.5 (.483) Biggest Weekly Storyline: The Guardians took the first two games of their pivotal White Sox series in walk-off fashion. Brayan Rocchio hit a walk-off homer on Thursday before Kahlil Watson singled in the 10th inning on Friday. 18. Phillies — 42.9–46.1 (.482) ⬆️ Biggest Weekly Storyline: The Phillies are hosting the 2026 All-Star Game and tied for the most representatives. Brandon Marsh, Bryce Harper, Kyle Schwarber, Cristopher Sanchez, and Jhoan Duran were announced on Saturday. 19. Giants — 42.2–45.8 (.480) Biggest Weekly Storyline: The Giants placed reliever Matt Gage on IL with elbow strain after 51-pitch relief appearance. Before Friday night, the lefty reliever's previous career high was 41 pitches thrown last July 21. 20. Orioles — 42.8–47.2 (.476) ⬇️ Biggest Weekly Storyline: Closer Ryan Helsley was placed on the injured list with right elbow discomfort. He was on the IL from May 1 to June 16 with right elbow inflammation. 21. Twins — 41.8–48.3 (.464) ⬆️ Biggest Weekly Storyline: On Sunday, Joe Ryan pitched seven shutout innings to help the Twins win a series in the Bronx for the first time since 2014. 22. Angels — 40.9–49.1 (.454) ⬇️ Biggest Weekly Storyline: Outfielder Mike Trout is hoping to return from injury for Angels next week ahead of the All-Star Game. Trout has been out since June 17, when he strained his right hamstring while running the bases against Arizona. 23. Diamondbacks — 39.7–48.4 (.451) Biggest Weekly Storyline: Reliever Ryan Thompson bounced a throw home in extra-innings that allowed an extra runner to score. He took responsibility after the game but it was a tough play no matter the outcome. 24. Astros — 40.8–50.2 (.448) ⬆️ Biggest Weekly Storyline: Starter Cristian Javier was reinstated from the 60-day injured list on Friday. A Grade 2 right shoulder strain has kept him out since April. 25. Padres — 39.4–48.6 (.448) ⬆️ Biggest Weekly Storyline: The Padres are the second team in MLB history to have a 6-game span with an 0-6 record, 75+ hits allowed, 60+ runs allowed, 30+ walks allowed, 15+ HR allowed. The other was the Phillies from June 19-22, 1929. 26. Mets — 39.5–49.5 (.444) ⬇️ Biggest Weekly Storyline: Juan Soto made headlines this week when asked about his relationship with Francisco Lindor from last year to this year. He said " When you meet a girl, you don’t start kissing her right away.” 27. Athletics — 37.6–51.4 (.422) Biggest Weekly Storyline: Former All-Star Brent Rooker will undergo season-ending knee surgery. It will take place during the All-Star break and address a cartilage tear in his left knee. 28. Royals — 36.8–52.2 (.414) ⬇️ Biggest Weekly Storyline: Shortstop Bobby Witt Jr. was named an All-Star starter for the first time in his career. He will be joined by Michael Wacha, who is making his second All-Star selection 11 years after his first. 29. Reds — 35.6–52.4 (.405) Biggest Weekly Storyline: Starter Hunter Greene returned to Cincinnati's rotation on Saturday. He allowed eight earned runs on seven hits and failed to make it out of the fourth frame. 30. Rockies — 35.4–54.6 (.393) Biggest Weekly Storyline: First baseman TJ Rumfield was selected as the NL’s Rookie of the Month for the second straight month. In June, he led all qualified National League rookies in average, on-base percentage, slugging percentage, doubles (9), extra-base hits (15) and total bases (56). What storylines stood out this week? Do you agree with the rankings above? Leave a comment and start the discussion.
 -
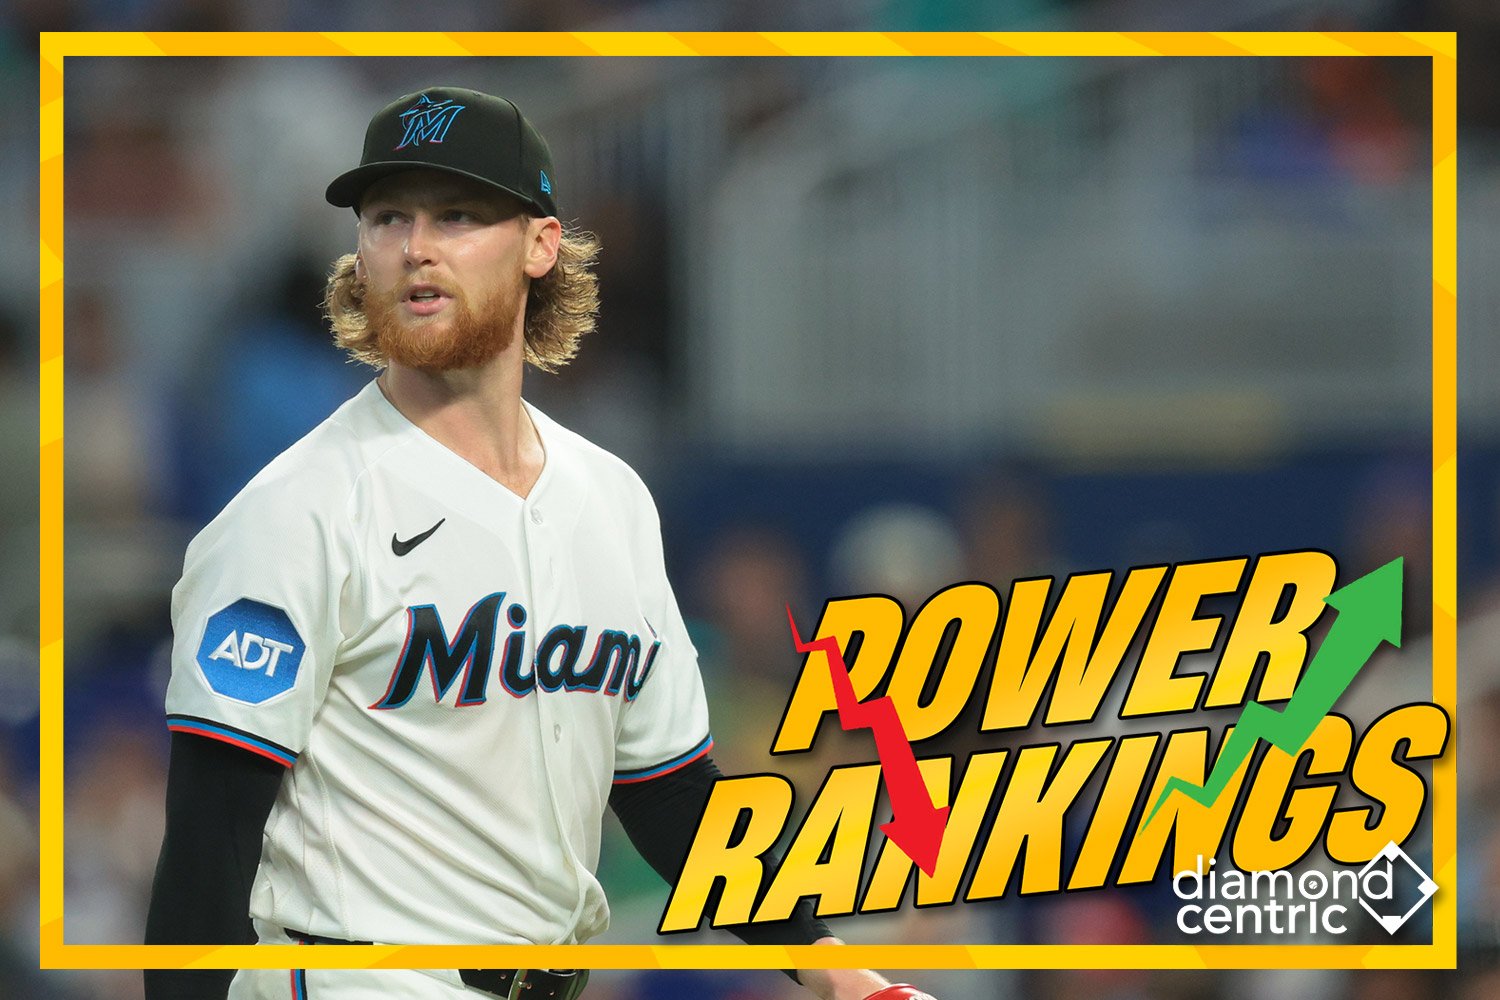
Image courtesy of © Sam Navarro-Imagn Images As the calendar turns to July, Major League Baseball enters one of its most important stretches of the season. The All-Star Game is just weeks away, the MLB Draft is right around the corner, and front offices are already preparing for the Trade Deadline. Every game carries a little more significance as contenders look to separate themselves and struggling clubs decide whether they can stay in the race. With over half a season in the books, dramatic swings in the power rankings become far less common. The sample size is now large enough that most teams have established who they are. Clubs at the top have consistently proven their quality, while those near the bottom face increasingly difficult odds of climbing back into contention. There is still room for movement, but week-to-week changes tend to be more gradual as the standings and underlying numbers stabilize. That makes third-order wins one of the best ways to evaluate how teams are truly performing. Based on Clay Davenport's adjusted standings, the metric looks beyond simple wins and losses by incorporating run differential, strength of schedule, and ballpark effects. The result is a clearer picture of which clubs are playing the best baseball and which may be benefiting from good fortune or favorable circumstances. These rankings are designed to reflect sustainable performance rather than short-term hot streaks. The arrows below indicate which teams are trending upward, slipping backward, or holding steady as the race toward October continues to take shape. 1. Dodgers — 57.0–25.9 (.688) Biggest Weekly Storyline: Mookie Betts hit his 300th career home run to become the 169th player in MLB history to reach that feat. 2. Yankees — 51.1–30.9 (.623) Biggest Weekly Storyline: New York allowed six unearned runs in a disastrous game against AL East rival Boston. The Yankees are still at the top of the AL, but that’s not saying much at this point. 3. Brewers — 49.8–30.2 (.622) Biggest Weekly Storyline: Brewers ace Jacob Misiorowski hit 105.5 mph in his last start, tied for 3rd-hardest pitch in the Statcast Era (since 2008). The only pitches harder than 105.5 mph in MLB history: Aroldis Chapman at 105.8 mph in 2010 and Aroldis Chapman at 105.7 mph in 2016. 4. Pirates — 46.4–36.6 (.559) ⬆️ Biggest Weekly Storyline: With a 41-41 record, the Pirates have their best halfway point record since 2015. It’s been a tremendous turnaround for a team that finished last in the NL Central with 71 wins in 2025. 5. Marlins — 46.2–36.8 (.557) ⬆️ Biggest Weekly Storyline: Starter Max Meyer improved to 9-0 on the season. Meyer remains the only qualified starter in the majors without a loss this season. He tied Livan Hernández (9-0 in 1997) for the best record to open a season in Marlins history. 6. Rays — 44.4–35.5 (.556) ⬇️ Biggest Weekly Storyline: The Rays became the first MLB team to carry a no-hit bid into the ninth inning while also having one player hit three home runs with Junior Caminero’s three homers. 7. Braves — 44.9–36.1 (.554) ⬇️ Biggest Weekly Storyline: Atlanta’s bullpen took another hit as right-hander Robert Suarez was placed on the 15-day injured list with elbow inflammation. Through 31 games, he’s posted a 0.56 ERA and recorded 26 strikeouts. 8. Cubs — 45.5–37.4 (.549) ⬇️ Biggest Weekly Storyline: Shortstop Dansby Swanson had 15 RBI across 3 games vs. Mets, including 11 in a doubleheader. Those are the most RBI a Cubs player has recorded in a series of fewer than five games since the RBI became an official stat in 1920. 9. Mariners — 42.9–41.1 (.511) Biggest Weekly Storyline: Seattle entered Saturday ranked 25th in MLB in runs per game at 4.02, a 651 run pace. In 2025, they concluded at 4.75 runs per game, 10th in MLB and a 766 run season. 10. White Sox — 41.3–39.7 (.510) ⬆️ Biggest Weekly Storyline: Chicago destroyed Kansas City on Friday by a final score of 22-1. The 22 runs tied for the second-most in White Sox history and the 21-run margin of victory ranks second all-time in club history. 11. Rangers — 42.2–40.8 (.508) Biggest Weekly Storyline: Rangers shortstop Corey Seager went 0-3 with two walks in return from the concussion list. However, Texas needs an offensive boost from arguably its biggest star. 12. Red Sox — 41.0–40.0 (.506) ⬆️ Biggest Weekly Storyline: Starter Payton Tolle dominated the Yankees on Friday night at Fenway. Over seven shutout innings, he allowed one hit and struck out seven. He began the game with five perfect frames. 13. Tigers — 41.9–41.1 (.505) ⬆️ Biggest Weekly Storyline: Pitchers Keider Montero and Emmanuel De Jesus combined for a five-hit shutout while both Venezuelans wore hats embroidered with “VZ” after this week's tragic earthquakes. 14. Blue Jays — 41.0–42.0 (.494) ⬇️ Biggest Weekly Storyline: Second baseman Ernie Clement automatically qualified for theAll-Star Game by winning the league's Phase 1 of fan voting. Clement got 3,232,932 and finished ahead of Astros slugger Yordan Alvarez (2,911,655 votes). 15. Orioles — 40.4–43.6 (.481) ⬆️ Biggest Weekly Storyline: Starter Trevor Rogers followed up his seven one-hit innings against the Los Angeles Dodgers last weekend by allowing a run and five hits in 6 1/3 innings Friday. He struck out seven without a walk. 16. Cardinals — 38.4–41.6 (.480) ⬇️ Biggest Weekly Storyline: Infielder Blaze Jordan has 12 RBI through his first 12 career games, matching Albert Pujols (2001) and J.D. Drew (1998) for most in franchise history through the first 12 career games. 17. Guardians — 39.8–43.3 (.479) ⬇️ Biggest Weekly Storyline: Cooper Ingle became the ninth player this season to make their big-league debut for Cleveland. His .551 slugging percentage leads Guardians' minor leaguers and his 12 home runs are tied for second. 18. Nationals — 40.1–43.9 (.477) ⬇️ Biggest Weekly Storyline: Between the three losses between Tuesday and Thursday, the Nationals were outscored 18-4 in the eighth and ninth innings by the Phillies. Washington’s bullpen has been its Achilles heel all year. 19. Phillies — 39.5–43.5 (.476) Biggest Weekly Storyline: Bryce Harper’s clutch 9th-inning home run helped the Phillies make MLB history. Philadelphia became the first MLB team to hit a go-ahead HR in the ninth inning of three consecutive games. 20. Angels — 39.9–44.1 (.475) ⬇️ Biggest Weekly Storyline: The Angels fired general manager Perry Minasian on Friday. Former St. Louis Cardinals president of baseball operations John Mozeliak will take over as interim general manager while the Angels search for Minasian's permanent replacement. 21. Royals — 35.4–41.7 (.459) ⬆️ Biggest Weekly Storyline: Shortstop Bobby Witt Jr. returned to the Royals lineup at DH on Friday after missing six games with an MCL sprain. On Saturday, he was back in the lineup and playing shortstop. 22. Diamondbacks — 37.5–44.5 (.457) ⬆️ Biggest Weekly Storyline: Outfielder Corbin Carroll is the Diamondbacks new franchise leader in triples with 53 in 566 games. He passed Stephen Drew who had 52 triples in 773 games. 23. Twins — 37.9–46.1 (.451) ⬇️ Biggest Weekly Storyline: Starter Mick Abel will have arthroscopic surgery after elbow injury setback. A timeline for his return won’t be established until after the surgery. 24. Mets — 37.4–45.6 (.451) Biggest Weekly Storyline: The Mets fired manager Carlos Mendoza. Andy Green has been named the interim manager through the end of the season. 25. Astros — 38.2–46.8 (.449) Biggest Weekly Storyline: Starter Tatsuya Imai struck out six batters through his first two innings on Friday. He finished the game with 11 K’s along with zero walks as Houston collected a comeback win over Cleveland. 26. Padres — 36.2–44.8 (.447) ⬆️ Biggest Weekly Storyline: Starter Walker Buehler pitched into the sixth inning and allowed one run for a victory over his former team (Los Angeles) on Friday night for the club’s fourth consecutive win. He yielded three hits and three walks with five strikeouts. 27. Athletics — 36.1–46.9 (.435) ⬇️ Biggest Weekly Storyline: The A’s have already combined for 22 comeback wins, most in the AL and fourth most in MLB. 28. Reds — 32.8–48.2 (.405) Biggest Weekly Storyline: On Friday Caleb Ferguson nailed down his first save of the season to become the 10th different Reds pitcher to record a save this season. That ties a team record since 1969 and it is still only June 27. 29. Rockies — 32.1–51.0 (.386) Biggest Weekly Storyline: At 32-49, the Rockies are already a plus-14 wins from where they were a year ago at the halfway mark. Over the last three seasons they’ve dropped 323 games (2023-25), tied for the fifth-most losses by a team over a three-year span in the modern era. 30. Giants — 40.4–41.6 (.493) Biggest Weekly Storyline: On Tuesday, San Francisco's president of baseball operations Buster Posey addressed the media for the first time since the Pride Night issues. He repeatedly said, “Baseball questions only” to multiple inquiries from the media. It was a poor look for a player and executive that will forever be tied to the Giants. What storylines stood out this week? Do you agree with the rankings above? Leave a comment and start the discussion. View full article
-
 As the calendar turns to July, Major League Baseball enters one of its most important stretches of the season. The All-Star Game is just weeks away, the MLB Draft is right around the corner, and front offices are already preparing for the Trade Deadline. Every game carries a little more significance as contenders look to separate themselves and struggling clubs decide whether they can stay in the race. With over half a season in the books, dramatic swings in the power rankings become far less common. The sample size is now large enough that most teams have established who they are. Clubs at the top have consistently proven their quality, while those near the bottom face increasingly difficult odds of climbing back into contention. There is still room for movement, but week-to-week changes tend to be more gradual as the standings and underlying numbers stabilize. That makes third-order wins one of the best ways to evaluate how teams are truly performing. Based on Clay Davenport's adjusted standings, the metric looks beyond simple wins and losses by incorporating run differential, strength of schedule, and ballpark effects. The result is a clearer picture of which clubs are playing the best baseball and which may be benefiting from good fortune or favorable circumstances. These rankings are designed to reflect sustainable performance rather than short-term hot streaks. The arrows below indicate which teams are trending upward, slipping backward, or holding steady as the race toward October continues to take shape. 1. Dodgers — 57.0–25.9 (.688) Biggest Weekly Storyline: Mookie Betts hit his 300th career home run to become the 169th player in MLB history to reach that feat. 2. Yankees — 51.1–30.9 (.623) Biggest Weekly Storyline: New York allowed six unearned runs in a disastrous game against AL East rival Boston. The Yankees are still at the top of the AL, but that’s not saying much at this point. 3. Brewers — 49.8–30.2 (.622) Biggest Weekly Storyline: Brewers ace Jacob Misiorowski hit 105.5 mph in his last start, tied for 3rd-hardest pitch in the Statcast Era (since 2008). The only pitches harder than 105.5 mph in MLB history: Aroldis Chapman at 105.8 mph in 2010 and Aroldis Chapman at 105.7 mph in 2016. 4. Pirates — 46.4–36.6 (.559) ⬆️ Biggest Weekly Storyline: With a 41-41 record, the Pirates have their best halfway point record since 2015. It’s been a tremendous turnaround for a team that finished last in the NL Central with 71 wins in 2025. 5. Marlins — 46.2–36.8 (.557) ⬆️ Biggest Weekly Storyline: Starter Max Meyer improved to 9-0 on the season. Meyer remains the only qualified starter in the majors without a loss this season. He tied Livan Hernández (9-0 in 1997) for the best record to open a season in Marlins history. 6. Rays — 44.4–35.5 (.556) ⬇️ Biggest Weekly Storyline: The Rays became the first MLB team to carry a no-hit bid into the ninth inning while also having one player hit three home runs with Junior Caminero’s three homers. 7. Braves — 44.9–36.1 (.554) ⬇️ Biggest Weekly Storyline: Atlanta’s bullpen took another hit as right-hander Robert Suarez was placed on the 15-day injured list with elbow inflammation. Through 31 games, he’s posted a 0.56 ERA and recorded 26 strikeouts. 8. Cubs — 45.5–37.4 (.549) ⬇️ Biggest Weekly Storyline: Shortstop Dansby Swanson had 15 RBI across 3 games vs. Mets, including 11 in a doubleheader. Those are the most RBI a Cubs player has recorded in a series of fewer than five games since the RBI became an official stat in 1920. 9. Mariners — 42.9–41.1 (.511) Biggest Weekly Storyline: Seattle entered Saturday ranked 25th in MLB in runs per game at 4.02, a 651 run pace. In 2025, they concluded at 4.75 runs per game, 10th in MLB and a 766 run season. 10. White Sox — 41.3–39.7 (.510) ⬆️ Biggest Weekly Storyline: Chicago destroyed Kansas City on Friday by a final score of 22-1. The 22 runs tied for the second-most in White Sox history and the 21-run margin of victory ranks second all-time in club history. 11. Rangers — 42.2–40.8 (.508) Biggest Weekly Storyline: Rangers shortstop Corey Seager went 0-3 with two walks in return from the concussion list. However, Texas needs an offensive boost from arguably its biggest star. 12. Red Sox — 41.0–40.0 (.506) ⬆️ Biggest Weekly Storyline: Starter Payton Tolle dominated the Yankees on Friday night at Fenway. Over seven shutout innings, he allowed one hit and struck out seven. He began the game with five perfect frames. 13. Tigers — 41.9–41.1 (.505) ⬆️ Biggest Weekly Storyline: Pitchers Keider Montero and Emmanuel De Jesus combined for a five-hit shutout while both Venezuelans wore hats embroidered with “VZ” after this week's tragic earthquakes. 14. Blue Jays — 41.0–42.0 (.494) ⬇️ Biggest Weekly Storyline: Second baseman Ernie Clement automatically qualified for theAll-Star Game by winning the league's Phase 1 of fan voting. Clement got 3,232,932 and finished ahead of Astros slugger Yordan Alvarez (2,911,655 votes). 15. Orioles — 40.4–43.6 (.481) ⬆️ Biggest Weekly Storyline: Starter Trevor Rogers followed up his seven one-hit innings against the Los Angeles Dodgers last weekend by allowing a run and five hits in 6 1/3 innings Friday. He struck out seven without a walk. 16. Cardinals — 38.4–41.6 (.480) ⬇️ Biggest Weekly Storyline: Infielder Blaze Jordan has 12 RBI through his first 12 career games, matching Albert Pujols (2001) and J.D. Drew (1998) for most in franchise history through the first 12 career games. 17. Guardians — 39.8–43.3 (.479) ⬇️ Biggest Weekly Storyline: Cooper Ingle became the ninth player this season to make their big-league debut for Cleveland. His .551 slugging percentage leads Guardians' minor leaguers and his 12 home runs are tied for second. 18. Nationals — 40.1–43.9 (.477) ⬇️ Biggest Weekly Storyline: Between the three losses between Tuesday and Thursday, the Nationals were outscored 18-4 in the eighth and ninth innings by the Phillies. Washington’s bullpen has been its Achilles heel all year. 19. Phillies — 39.5–43.5 (.476) Biggest Weekly Storyline: Bryce Harper’s clutch 9th-inning home run helped the Phillies make MLB history. Philadelphia became the first MLB team to hit a go-ahead HR in the ninth inning of three consecutive games. 20. Angels — 39.9–44.1 (.475) ⬇️ Biggest Weekly Storyline: The Angels fired general manager Perry Minasian on Friday. Former St. Louis Cardinals president of baseball operations John Mozeliak will take over as interim general manager while the Angels search for Minasian's permanent replacement. 21. Royals — 35.4–41.7 (.459) ⬆️ Biggest Weekly Storyline: Shortstop Bobby Witt Jr. returned to the Royals lineup at DH on Friday after missing six games with an MCL sprain. On Saturday, he was back in the lineup and playing shortstop. 22. Diamondbacks — 37.5–44.5 (.457) ⬆️ Biggest Weekly Storyline: Outfielder Corbin Carroll is the Diamondbacks new franchise leader in triples with 53 in 566 games. He passed Stephen Drew who had 52 triples in 773 games. 23. Twins — 37.9–46.1 (.451) ⬇️ Biggest Weekly Storyline: Starter Mick Abel will have arthroscopic surgery after elbow injury setback. A timeline for his return won’t be established until after the surgery. 24. Mets — 37.4–45.6 (.451) Biggest Weekly Storyline: The Mets fired manager Carlos Mendoza. Andy Green has been named the interim manager through the end of the season. 25. Astros — 38.2–46.8 (.449) Biggest Weekly Storyline: Starter Tatsuya Imai struck out six batters through his first two innings on Friday. He finished the game with 11 K’s along with zero walks as Houston collected a comeback win over Cleveland. 26. Padres — 36.2–44.8 (.447) ⬆️ Biggest Weekly Storyline: Starter Walker Buehler pitched into the sixth inning and allowed one run for a victory over his former team (Los Angeles) on Friday night for the club’s fourth consecutive win. He yielded three hits and three walks with five strikeouts. 27. Athletics — 36.1–46.9 (.435) ⬇️ Biggest Weekly Storyline: The A’s have already combined for 22 comeback wins, most in the AL and fourth most in MLB. 28. Reds — 32.8–48.2 (.405) Biggest Weekly Storyline: On Friday Caleb Ferguson nailed down his first save of the season to become the 10th different Reds pitcher to record a save this season. That ties a team record since 1969 and it is still only June 27. 29. Rockies — 32.1–51.0 (.386) Biggest Weekly Storyline: At 32-49, the Rockies are already a plus-14 wins from where they were a year ago at the halfway mark. Over the last three seasons they’ve dropped 323 games (2023-25), tied for the fifth-most losses by a team over a three-year span in the modern era. 30. Giants — 40.4–41.6 (.493) Biggest Weekly Storyline: On Tuesday, San Francisco's president of baseball operations Buster Posey addressed the media for the first time since the Pride Night issues. He repeatedly said, “Baseball questions only” to multiple inquiries from the media. It was a poor look for a player and executive that will forever be tied to the Giants. What storylines stood out this week? Do you agree with the rankings above? Leave a comment and start the discussion.
 -
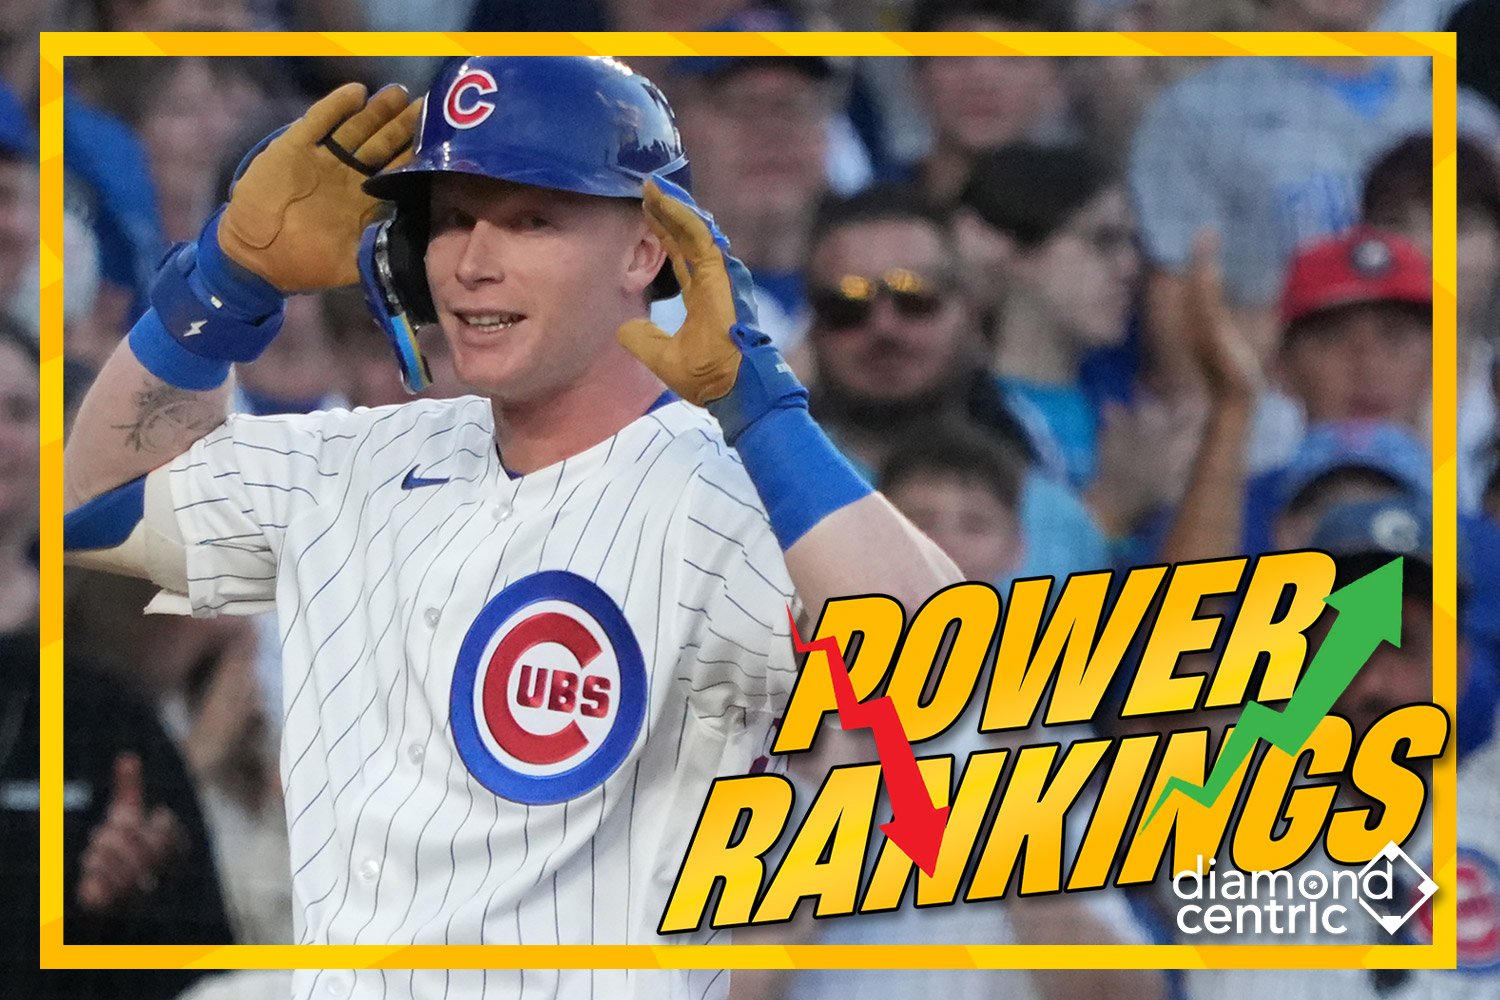
Image courtesy of © David Banks-Imagn Images By late June, dramatic movement in the power rankings becomes increasingly rare. The sample size is large enough that the league's true contenders have largely established themselves, while struggling clubs are finding it more difficult to climb out of the holes they created earlier in the season. There are still opportunities for teams to rise or fall, but week-to-week changes tend to be smaller as the standings and underlying metrics begin to stabilize. That is why third-order wins remain such a useful lens for evaluating the league. Based on Clay Davenport's adjusted standings, the metric goes beyond wins and losses by factoring in run differential, quality of competition, and ballpark effects. The goal is to identify which teams are genuinely playing the best baseball rather than simply riding favorable sequencing or a soft portion of the schedule. At the top, both leagues feature clubs that have clearly separated themselves from the pack. The American League and National League each boast multiple teams with elite records and strong underlying performance indicators, making it increasingly clear which organizations are built for a deep postseason run. These rankings are built to highlight sustainable performance over temporary momentum. The arrows below show which teams are trending upward, slipping backward, or holding steady as the postseason race slowly starts to take shape. 1. Dodgers — 53.3–23.6 (.693) Biggest Weekly Storyline: Shohei Ohtani homered on the eve of Father’s Day after the birth of his second child this week. 2. Yankees — 48.2–26.7 (.644) Biggest Weekly Storyline: Cam Schlittler became the youngest Yankees pitcher with 13 strikeouts and no walks in a 5-0 win over the Reds. His 1.71 ERA after 16 starts is also the lowest since Whitey Ford's 1.47 mark in 1964. 3. Brewers — 46.1–27.9 (.623) Biggest Weekly Storyline: In Jacob Misiorowski's last nine starts, he has struck out 87 hitters and allowed just one total extra-base hit, a double. He’s the only pitcher since at least 1900 with 60+ strikeouts and one or no extra-base hits allowed in a 9-game span 4. Braves — 43.5–31.5 (.580) Biggest Weekly Storyline: The Braves trade for catching depth by adding former number two overall pick Joey Bart from the Pirates. Atlanta needed a backup catcher, while Pittsburgh had to break up a roster logjam behind the plate. 5. Pirates — 42.3–34.7 (.549) Biggest Weekly Storyline: Bryan Reynolds was scratched from a lineup earlier this week with left groin discomfort. However, he was available to pinch hit in the eighth inning and tied the game with an RBI single. 6. Cubs — 42.1–34.8 (.547) ⬆️ Biggest Weekly Storyline: Pete Crow-Armstrong is the first player in MLB’s modern era to tally 34 hits, five doubles, two triples, nine home runs, and six stolen bases in any 18-game span in a season. 7. Marlins — 42.0–35.0 (.545) ⬇️ Biggest Weekly Storyline: Miami has won nine of its last 10 home games. Owen Caissie homered in two consecutive games, and he had a stretch with three homers in seven games. 8. Rays — 39.4–33.6 (.540) ⬆️ Biggest Weekly Storyline: Cedric Mullins has a 69 wRC+ for the season, but has posted a 138 wRC+ since May 15th. He had a back issue he tried to play through early in the season. 9. Mariners — 40.0–38.0 (.513) ⬇️ Biggest Weekly Storyline: Mariners outfielder Julio Rodriguez left a game against the Orioles with a left hamstring spasm. Earlier this week, he became the third-fastest player in MLB history to reach 125 doubles, 125 homers, and 125 steals. 10. Blue Jays — 38.6–38.4 (.501) Biggest Weekly Storyline: On Thursday, Vladimir Guerrero Jr. hit his first home run since May 17th. Unfortunately, he missed time over the last week with lower back tightness. 11. Rangers — 38.0–38.0 (.500) Biggest Weekly Storyline: Nathan Eovaldi was scratched from his start on Saturday because of left knee soreness. If the Rangers become sellers, he could be a popular trade chip. 12. White Sox — 37.5–37.5 (.500) Biggest Weekly Storyline: Andrew Benintendi became only the second opposing player in Yankee Stadium history to launch a pinch-hit, go-ahead grand slam in the eighth inning or later. Tommy Byrne, a pitcher, did it way back on May 16, 1953. 13. Guardians — 38.2–38.8 (.496) ⬆️ Biggest Weekly Storyline: Rookie Travis Bazzana helped Cleveland avoid being swept by the Brewers when he hit a go-ahead homer in the seventh inning. 14. Cardinals — 36.6–37.4 (.495) ⬇️ Biggest Weekly Storyline: Starter Matthew Liberatore has a 6.82 ERA over his last seven starts and hasn’t pitched five innings or more in three straight starts. For a contending team, something has to change. 15. Red Sox — 36.5–37.5 (.493) Biggest Weekly Storyline: Starter Ranger Suarez took a no-hitter into the seventh inning to help Boston defeat Seattle. He struck out five and walked three in 6 2/3 innings. 16. Tigers — 37.1–38.9 (.488) Biggest Weekly Storyline: Justin Verlander was scratched from his return start with the Tigers after suffering a left hamstring strain. It’s getting close to the end of the road for the future Hall of Famer. 17. Nationals — 37.4–39.6 (.486) Biggest Weekly Storyline: The Nationals have been one of baseball’s biggest surprises this year. Washington has won four straight series entering this past weekend against Tampa. 18. Angels — 37.0–41.0 (.474) Biggest Weekly Storyline: Mike Trout headed to the 10-day IL with a hamstring strain that interrupted a resurgent season. He has 17 homers and ranks in the top-10 in OBP. 19. Phillies — 35.5–40.5 (.467)⬆️ Biggest Weekly Storyline: On Saturday, Bryce Harper hit for the first cycle of his career, completing the feat in just five innings. It was the 11th cycle in Phillies history. Not to be outdone, Kyle Schwarber hit three homers in the same game. 20. Orioles — 36.2–41.8 (.464) ⬆️ Biggest Weekly Storyline: Infielder Jackson Holliday has struggled since returning from injury. In 27 games, he has a .683 OPS with four homers and 27 strikeouts across 92 plate appearances. 21. Twins — 35.9–42.1 (.460) ⬆️ Biggest Weekly Storyline: Outfielder Byron Buxton continues to hear his name in national trade speculation, but his response has remained constant. This week, he said, “I don’t give a f–k.” and finished the statement with, “I’m a Twin.” 22. Royals — 35.4–41.7 (.459) ⬆️ Biggest Weekly Storyline: Perennial MVP candidate Bobby Witt Jr. left Thursday’s game with a knee injury and was diagnosed with a grade 1 MCL sprain. The team is calling it the “best-case scenario.” 23. Diamondbacks — 34.6–41.4 (.455) ⬇️ Biggest Weekly Storyline: Starter Ryne Nelson became Arizona’s latest starter to end up on the IL with an elbow injury. Then Michael Soroka left Friday’s start with a hip injury after just one inning. 24. Mets — 34.4–41.7 (.452) Biggest Weekly Storyline: Since May 1st, rookie Carson Benge is batting .291 with five homers and a .351 OBP. He has seven games with at least three hits, the most by any MLB rookie. 25. Astros — 35.2–42.9 (.451) ⬇️ Biggest Weekly Storyline: Starter Tatsuya Imai struck out six batters through his first two innings on Friday. He finished the game with 11 K’s along with zero walks as Houston collected a comeback win over Cleveland. 26. Athletics — 34.3–42.7 (.445) ⬇️ Biggest Weekly Storyline: Left-hander Gage Jump completed seven scoreless innings and gave up one hit and three walks while striking out seven. The rookie has completed six innings in three of his five big-league starts. 27. Padres — 32.2–42.8 (.429) Biggest Weekly Storyline: MLB insider Buster Olney believes Padres president of baseball operations AJ Preller is on the hot seat. Recent blockbuster trades for Juan Soto and Mason Miller have decimated the farm system and could leave him with little to move at the trade deadline. 28. Reds — 29.9–45.1 (.399) Biggest Weekly Storyline: Starter Brady Singer is having a letdown season in 2026. In 14 starts, he has a 5.32 ERA. His 5.6 HR/9 is nearly double his previous career-high. 29. Rockies — 29.0–48.1 (.376) Biggest Weekly Storyline: Kyle Freeland struck out eight on Friday, including his 1,000th career strikeout. 30. Giants — 36.6–39.4 (.482) Biggest Weekly Storyline: The Giants' “Pride Night” cap controversy from last week has continued to be the focus for a bad baseball team. Multiple San Francisco pitchers inscribed Bible verses on their rainbow-themed caps. MLB issued a warning that it was a violation of team rules. Later in the week, a Civil Rights attorney wrote a letter to Rob Manfred saying she will investigate MLB for religious discrimination. What storylines stood out this week? Do you agree with the rankings above? Leave a comment and start the discussion. View full article
-
MLB Power Rankings: Cubs Back On Track, Brewers Closing On Yankees
Cody Christie posted an article in MLB
 By late June, dramatic movement in the power rankings becomes increasingly rare. The sample size is large enough that the league's true contenders have largely established themselves, while struggling clubs are finding it more difficult to climb out of the holes they created earlier in the season. There are still opportunities for teams to rise or fall, but week-to-week changes tend to be smaller as the standings and underlying metrics begin to stabilize. That is why third-order wins remain such a useful lens for evaluating the league. Based on Clay Davenport's adjusted standings, the metric goes beyond wins and losses by factoring in run differential, quality of competition, and ballpark effects. The goal is to identify which teams are genuinely playing the best baseball rather than simply riding favorable sequencing or a soft portion of the schedule. At the top, both leagues feature clubs that have clearly separated themselves from the pack. The American League and National League each boast multiple teams with elite records and strong underlying performance indicators, making it increasingly clear which organizations are built for a deep postseason run. These rankings are built to highlight sustainable performance over temporary momentum. The arrows below show which teams are trending upward, slipping backward, or holding steady as the postseason race slowly starts to take shape. 1. Dodgers — 53.3–23.6 (.693) Biggest Weekly Storyline: Shohei Ohtani homered on the eve of Father’s Day after the birth of his second child this week. 2. Yankees — 48.2–26.7 (.644) Biggest Weekly Storyline: Cam Schlittler became the youngest Yankees pitcher with 13 strikeouts and no walks in a 5-0 win over the Reds. His 1.71 ERA after 16 starts is also the lowest since Whitey Ford's 1.47 mark in 1964. 3. Brewers — 46.1–27.9 (.623) Biggest Weekly Storyline: In Jacob Misiorowski's last nine starts, he has struck out 87 hitters and allowed just one total extra-base hit, a double. He’s the only pitcher since at least 1900 with 60+ strikeouts and one or no extra-base hits allowed in a 9-game span 4. Braves — 43.5–31.5 (.580) Biggest Weekly Storyline: The Braves trade for catching depth by adding former number two overall pick Joey Bart from the Pirates. Atlanta needed a backup catcher, while Pittsburgh had to break up a roster logjam behind the plate. 5. Pirates — 42.3–34.7 (.549) Biggest Weekly Storyline: Bryan Reynolds was scratched from a lineup earlier this week with left groin discomfort. However, he was available to pinch hit in the eighth inning and tied the game with an RBI single. 6. Cubs — 42.1–34.8 (.547) ⬆️ Biggest Weekly Storyline: Pete Crow-Armstrong is the first player in MLB’s modern era to tally 34 hits, five doubles, two triples, nine home runs, and six stolen bases in any 18-game span in a season. 7. Marlins — 42.0–35.0 (.545) ⬇️ Biggest Weekly Storyline: Miami has won nine of its last 10 home games. Owen Caissie homered in two consecutive games, and he had a stretch with three homers in seven games. 8. Rays — 39.4–33.6 (.540) ⬆️ Biggest Weekly Storyline: Cedric Mullins has a 69 wRC+ for the season, but has posted a 138 wRC+ since May 15th. He had a back issue he tried to play through early in the season. 9. Mariners — 40.0–38.0 (.513) ⬇️ Biggest Weekly Storyline: Mariners outfielder Julio Rodriguez left a game against the Orioles with a left hamstring spasm. Earlier this week, he became the third-fastest player in MLB history to reach 125 doubles, 125 homers, and 125 steals. 10. Blue Jays — 38.6–38.4 (.501) Biggest Weekly Storyline: On Thursday, Vladimir Guerrero Jr. hit his first home run since May 17th. Unfortunately, he missed time over the last week with lower back tightness. 11. Rangers — 38.0–38.0 (.500) Biggest Weekly Storyline: Nathan Eovaldi was scratched from his start on Saturday because of left knee soreness. If the Rangers become sellers, he could be a popular trade chip. 12. White Sox — 37.5–37.5 (.500) Biggest Weekly Storyline: Andrew Benintendi became only the second opposing player in Yankee Stadium history to launch a pinch-hit, go-ahead grand slam in the eighth inning or later. Tommy Byrne, a pitcher, did it way back on May 16, 1953. 13. Guardians — 38.2–38.8 (.496) ⬆️ Biggest Weekly Storyline: Rookie Travis Bazzana helped Cleveland avoid being swept by the Brewers when he hit a go-ahead homer in the seventh inning. 14. Cardinals — 36.6–37.4 (.495) ⬇️ Biggest Weekly Storyline: Starter Matthew Liberatore has a 6.82 ERA over his last seven starts and hasn’t pitched five innings or more in three straight starts. For a contending team, something has to change. 15. Red Sox — 36.5–37.5 (.493) Biggest Weekly Storyline: Starter Ranger Suarez took a no-hitter into the seventh inning to help Boston defeat Seattle. He struck out five and walked three in 6 2/3 innings. 16. Tigers — 37.1–38.9 (.488) Biggest Weekly Storyline: Justin Verlander was scratched from his return start with the Tigers after suffering a left hamstring strain. It’s getting close to the end of the road for the future Hall of Famer. 17. Nationals — 37.4–39.6 (.486) Biggest Weekly Storyline: The Nationals have been one of baseball’s biggest surprises this year. Washington has won four straight series entering this past weekend against Tampa. 18. Angels — 37.0–41.0 (.474) Biggest Weekly Storyline: Mike Trout headed to the 10-day IL with a hamstring strain that interrupted a resurgent season. He has 17 homers and ranks in the top-10 in OBP. 19. Phillies — 35.5–40.5 (.467)⬆️ Biggest Weekly Storyline: On Saturday, Bryce Harper hit for the first cycle of his career, completing the feat in just five innings. It was the 11th cycle in Phillies history. Not to be outdone, Kyle Schwarber hit three homers in the same game. 20. Orioles — 36.2–41.8 (.464) ⬆️ Biggest Weekly Storyline: Infielder Jackson Holliday has struggled since returning from injury. In 27 games, he has a .683 OPS with four homers and 27 strikeouts across 92 plate appearances. 21. Twins — 35.9–42.1 (.460) ⬆️ Biggest Weekly Storyline: Outfielder Byron Buxton continues to hear his name in national trade speculation, but his response has remained constant. This week, he said, “I don’t give a f–k.” and finished the statement with, “I’m a Twin.” 22. Royals — 35.4–41.7 (.459) ⬆️ Biggest Weekly Storyline: Perennial MVP candidate Bobby Witt Jr. left Thursday’s game with a knee injury and was diagnosed with a grade 1 MCL sprain. The team is calling it the “best-case scenario.” 23. Diamondbacks — 34.6–41.4 (.455) ⬇️ Biggest Weekly Storyline: Starter Ryne Nelson became Arizona’s latest starter to end up on the IL with an elbow injury. Then Michael Soroka left Friday’s start with a hip injury after just one inning. 24. Mets — 34.4–41.7 (.452) Biggest Weekly Storyline: Since May 1st, rookie Carson Benge is batting .291 with five homers and a .351 OBP. He has seven games with at least three hits, the most by any MLB rookie. 25. Astros — 35.2–42.9 (.451) ⬇️ Biggest Weekly Storyline: Starter Tatsuya Imai struck out six batters through his first two innings on Friday. He finished the game with 11 K’s along with zero walks as Houston collected a comeback win over Cleveland. 26. Athletics — 34.3–42.7 (.445) ⬇️ Biggest Weekly Storyline: Left-hander Gage Jump completed seven scoreless innings and gave up one hit and three walks while striking out seven. The rookie has completed six innings in three of his five big-league starts. 27. Padres — 32.2–42.8 (.429) Biggest Weekly Storyline: MLB insider Buster Olney believes Padres president of baseball operations AJ Preller is on the hot seat. Recent blockbuster trades for Juan Soto and Mason Miller have decimated the farm system and could leave him with little to move at the trade deadline. 28. Reds — 29.9–45.1 (.399) Biggest Weekly Storyline: Starter Brady Singer is having a letdown season in 2026. In 14 starts, he has a 5.32 ERA. His 5.6 HR/9 is nearly double his previous career-high. 29. Rockies — 29.0–48.1 (.376) Biggest Weekly Storyline: Kyle Freeland struck out eight on Friday, including his 1,000th career strikeout. 30. Giants — 36.6–39.4 (.482) Biggest Weekly Storyline: The Giants' “Pride Night” cap controversy from last week has continued to be the focus for a bad baseball team. Multiple San Francisco pitchers inscribed Bible verses on their rainbow-themed caps. MLB issued a warning that it was a violation of team rules. Later in the week, a Civil Rights attorney wrote a letter to Rob Manfred saying she will investigate MLB for religious discrimination. What storylines stood out this week? Do you agree with the rankings above? Leave a comment and start the discussion.
 -
MLB Power Rankings: Brewers Charging, Marlins & Blue Jays Surprise
Cody Christie posted an article in MLB
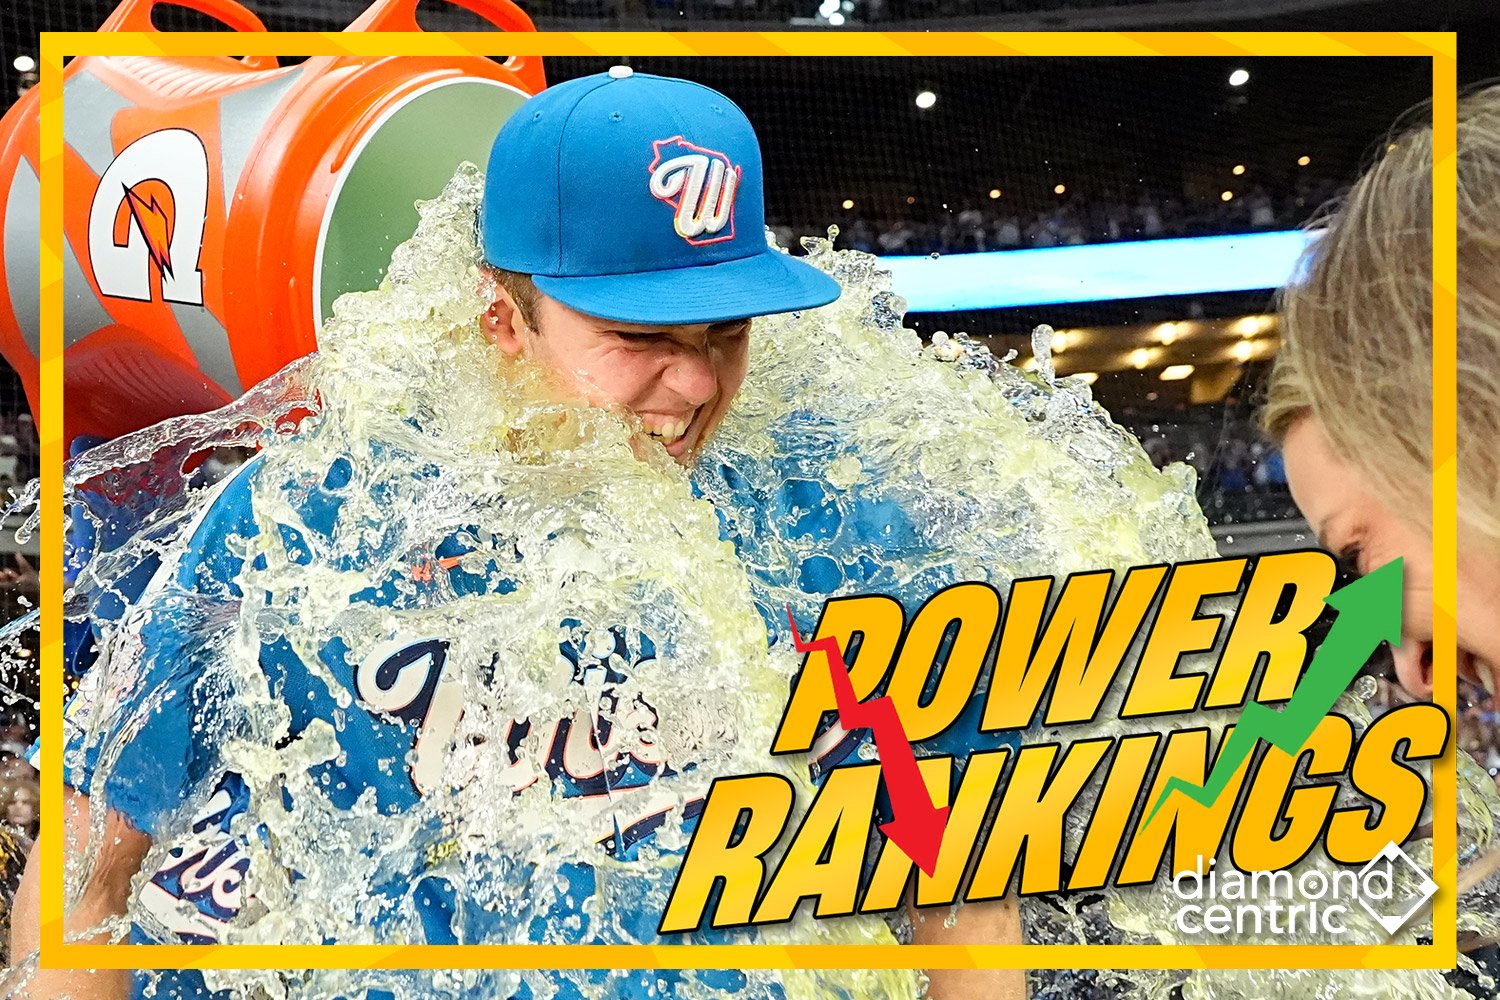 The San Francisco Giants find themselves near the bottom of this week's rankings for reasons that extend beyond their disappointing play on the field. The organization found itself at the center of controversy during Pride Night, creating another unwanted headline in a season filled with frustration. One of the biggest developments this week is the rise of the Brewers into the top three. Milwaukee continues to pair strong results with impressive underlying metrics, further strengthening the National League's hold on the upper tier of these rankings. There were also notable climbs by the Marlins and Blue Jays, two teams that have quietly surged into the top 10 after spending much of the season outside the league's elite. That is why third-order wins remain such a useful lens for evaluating the league. Based on Clay Davenport's adjusted standings, the metric goes beyond wins and losses by factoring in run differential, quality of competition, and ballpark effects. The goal is to identify which teams are genuinely playing the best baseball rather than simply riding favorable sequencing or a soft portion of the schedule. These rankings are built to highlight sustainable performance over temporary momentum. The arrows below show which teams are trending upward, slipping backward, or holding steady as the postseason race slowly starts to take shape. 1. Dodgers — 49.5–21.4 (.698) Biggest Weekly Storyline: Yoshinobu Yamamoto lost a perfect game in the eighth inning on a Mookie Betts error and gave up a solo home run in the ninth to lose the no-hitter. Over his last two starts, Yamamoto retired 45 batters in a row, the second longest streak in baseball’s live-ball era. 2. Yankees — 44.0–24.9 (.639) Biggest Weekly Storyline: Since May 1, Yankees catchers have a combined 8 wRC+, a slash line of .130/.205/.165, and a strikeout rate of 30.7%. They have a combined 15 hits and 11 walks since May 1. 3. Brewers — 41.4–26.5 (.610) ⬆️ Biggest Weekly Storyline: On Friday, Jacob Misiorowski began the game by throwing the fastest pitch ever recorded by a starting pitcher (104.5 mph). His final line: 15 strikeouts, 1 hit allowed, 0 walks, 0 runs on 95 pitches. He faced the minimum across nine innings, as his lone hit allowed in the fourth inning was erased by a double play. 4. Braves — 42.6–27.4 (.609) ⬇️ Biggest Weekly Storyline: The Braves put Ronald Acuña Jr. on the 10-day injured list with a left hamstring strain. It is Acuña’s second left hamstring injury this season. 5. Pirates — 39.4–31.5 (.556) Biggest Weekly Storyline: Evan Sisk has been a breakout player for the Pirates. The left-hander has a 1.29 ERA and 2.54 FIP with 36 strikeouts in 23 games in 2026. 6. Marlins — 38.9–32.1 (.548) ⬆️ Biggest Weekly Storyline: Sandy Alcantara became the fifth active Dominican-born pitcher to reach 1,000 K's. He joins Luis Castillo, Freddy Peralta, Luis Severino, and Framber Valdez. 7. Mariners — 38.7–33.3 (.538) Biggest Weekly Storyline: Mariners starter Bryce Miller has coaxed five double plays this season in 35 innings, matching his 2025 total in 90 1/3 innings and just one shy of his 2024 total in 180 1/3 innings. 8. Cubs — 38.1–32.9 (.537) ⬇️ Biggest Weekly Storyline: Ben Brown has an impressive 1.44 ERA across 31 1/3 innings pitched since moving to the rotation. That ERA since May 8 is the sixth-lowest in baseball, only behind Jacob Misiorowski (0.23 ERA), Cristopher Sanchez (0.24 ERA), Shohei Ohtani (0.37 ERA), Kyle Harrison (0.90 ERA), and Bryce Miller (1.33 ERA). 9. Rays — 35.4–31.8 (.527) Biggest Weekly Storyline: Drew Rasmussen recorded a career-high 13 Ks as he struck out the Red Sox's top three batters three times each in win. His previous career high was 10 Ks back in 2022. 10. Blue Jays — 36.7–34.3 (.517) ⬆️ Biggest Weekly Storyline: Alejandro Kirk got three hits in his return from the 60-day IL after recovering from a left thumb fracture. He reached base four times and drove in two runs as the Blue Jays beat the Yankees. 11. Rangers — 35.9–34.1 (.513) Biggest Weekly Storyline: Corey Seager has had yet another injury-riddled season to start his 2026 campaign. He had a scary home plate collision on Thursday and has pain in his jaw and ribs. 12. White Sox — 35.0–34.0 (.507) ⬆️ Biggest Weekly Storyline: Outfielder Braden Montgomery became just the fifth player in MLB history to hit a walk-off home run in their debut since 1900. The other players on that list? Carlos Perez (2015), Miguel Cabrera (2003), Josh Bard (2002), and Billy Parker (1971). 13. Cardinals — 34.5–33.5 (.507) ⬆️ Biggest Weekly Storyline: Infielder Blaze Jordan forced the Cardinals' to call him up. The 23-year-old corner was slashing .313/.373/.548 with 11 home runs, 35 RBIs and a .921 OPS in 57 games. 14. Guardians — 35.9–36.1 (.499) ⬇️ Biggest Weekly Storyline: The Guardians lost All-Star third baseman Jose Ramirez to the IL with a fractured left hamate bone. Injuries like this can take six to eight weeks to heal after surgery. 15. Red Sox — 33.4–34.6 (.491) Biggest Weekly Storyline: Closer Aroldis Chapman was on a podcast this week and said if Yankees trade for him that general manager Brian Cashman should apologize first. He missed a workout and was left off New York’s 2022 ALDS roster. 16. Tigers — 34.7–36.3 (.489) ⬆️ Biggest Weekly Storyline: Reigning AL Cy Young winner Tarik Skubal returned to the mound on Saturday just 38 days after having surgery on his left elbow. He allowed three runs (two earned) in 4 2/3 innings with four strikeouts and one walk. 17. Nationals — 34.6–36.4 (.487) ⬇️ Biggest Weekly Storyline: At just 23-years-old, James Wood might be the NL’s best overall hitter. He currently has the 4th highest barrel rate in the Statcast Era, trailing only three historic Aaron Judge seasons (2017, 2022, 2024). 18. Angels — 33.9–37.1 (.477) ⬆️ Biggest Weekly Storyline: Mike Trout hit his 1,000th single of his career this week. The future Hall of Famer has over 1800 career hits. He leads the AL in walks and runs this season. 19. Diamondbacks — 33.0–37.0 (.471) Biggest Weekly Storyline: Outfielder Jordan Lawlar returned from a two-month stay on the IL. In his first game back he made a terrific catch in the outfield, reached base three times, stole a pair of bases and delivered a two-run single to cap the Diamondbacks’ scoring in a tiebreaking, three-run ninth inning. 20. Athletics — 32.6–37.4 (.466) ⬆️ Biggest Weekly Storyline: The A's activate shortstop Jacob Wilson and placed DH Brent Rooker on injured list with a left knee bruise. Wilson had missed a month with a dislocated left shoulder. 21. Orioles — 33.5–38.5 (.465) ⬆️ Biggest Weekly Storyline: Gunnar Henderson hit his 100th career home run on Friday night. He became the fifth O’s player to reach 100 for the club before turning 25, including Manny Machado, Eddie Murray, Cal Ripken Jr., and Boog Powell. 22. Phillies — 32.3–37.7 (.461) ⬇️ Biggest Weekly Storyline: Zack Wheeler didn’t allow a hit to the Padres until sixth, and finished with seven innings by allowing two runs and striking out eight. In the same game, the Phillies cleared the 4-run threshold for the first time since May 18. 23. Astros — 32.5–39.5 (.451) ⬆️ Biggest Weekly Storyline: Astros slugger Yordan Alvarez became the first MLB player to hit a grand slam and multi-run home runs in the 1st inning on Friday night. He's currently leads the AL in homers. 24. Mets — 31.2–38.9 (.445) ⬆️ Biggest Weekly Storyline: Bo Bichette had two homers including a grand slam as he drove in six runs to lead Mets past Braves 7-5. 25. Royals — 31.2–39.9 (.439) ⬇️ Biggest Weekly Storyline: Starting pitcher Seth Lugo was forced to leave Wednesday’s contest early after taking a 107-mph line drive off his forehead. The team reports he is “doing well” but he’s had to go on the 7-day concussion IL. 26. Twins — 31.0–41.1 (.430) ⬇️ Biggest Weekly Storyline: Minnesota made a tremendous comeback on Friday night. Kody Clemens hit a three-run bomb in the seventh inning. Then Royce Lewis and Brooks Lee hit solo shots in the bottom of the ninth to put the Twins up for good. 27. Padres — 29.5–39.5 (.428) ⬆️ Biggest Weekly Storyline: The Padres have lost 13 of their last 18 games. San Diego ranks at the bottom of baseball in batting average, on-base percentage, slugging percentage, and runs scored. 28. Reds — 26.8–42.3 (.388) ⬆️ Biggest Weekly Storyline: Tejay Antone has been a surprise contributor to the Reds bullpen. After three arm surgeries, he returned to the big-leagues and has registered a save, 14 strikeouts, four walks, and a 1.14 WHIP in 14 innings. 29. Rockies — 25.2–45.8 (.355) ⬆️ Biggest Weekly Storyline: Hunter Goodman, Cole Carrigg, and TJ Rumfield are giving Rockies fans something to be excited about. This young trio fueled a Rockies' series win over Cubs. 30. Giants — 32.8–38.2 (.462) ⬇️ Biggest Weekly Storyline: San Francisco should be higher on this list based solely on its projected record, but the Giants have earned a spot at the bottom. The organization hosted Pride Night on Friday, with players wearing rainbow-themed SF caps as part of the celebration. On a night intended to recognize and support the LGBTQ+ community—a significant part of both the fan base and the city itself—the focus instead shifted to a message that many viewed as exclusionary. Four of the Giants' five pitchers made statements regarding the team's choice of headwear. Landen Roupp, JT Brubaker , and Ryan Walker wrote Genesis 9:11-16 on their caps, a passage that references God's covenant symbolized by the rainbow. In recent years, some Christians have cited the verse while arguing that the rainbow is exclusively a religious symbol and that its use in Pride imagery represents an appropriation of something sacred. Meanwhile, Sam Hentges chose not to wear the rainbow cap at all. The Giants went on to lose 5-1 and now sit 14 games under .500 with the National League's second-worst record. Giants fans deserve better than having a celebration intended to unite the community overshadowed by controversy. What storylines stood out this week? Do you agree with the rankings above? Leave a comment and start the discussion.
 -
The San Francisco Giants find themselves near the bottom of this week's rankings for reasons that extend beyond their disappointing play on the field. The organization found itself at the center of controversy during Pride Night, creating another unwanted headline in a season filled with frustration. More details on that situation can be found below. One of the biggest developments this week is the rise of the Brewers into the top three. Milwaukee continues to pair strong results with impressive underlying metrics, further strengthening the National League's hold on the upper tier of these rankings. There were also notable climbs by the Marlins and Blue Jays, two teams that have quietly surged into the top 10 after spending much of the season outside the league's elite. That is why third-order wins remain such a useful lens for evaluating the league. Based on Clay Davenport's adjusted standings, the metric goes beyond wins and losses by factoring in run differential, quality of competition, and ballpark effects. The goal is to identify which teams are genuinely playing the best baseball rather than simply riding favorable sequencing or a soft portion of the schedule. These rankings are built to highlight sustainable performance over temporary momentum. The arrows below show which teams are trending upward, slipping backward, or holding steady as the postseason race slowly starts to take shape. 1. Dodgers — 49.5–21.4 (.698) Biggest Weekly Storyline: Yoshinobu Yamamoto lost a perfect game in the eighth inning on a Mookie Betts error and gave up a solo home run in the ninth to lose the no-hitter. Over his last two starts, Yamamoto retired 45 batters in a row, the second longest streak in baseball’s live-ball era. 2. Yankees — 44.0–24.9 (.639) Biggest Weekly Storyline: Since May 1, Yankees catchers have a combined 8 wRC+, a slash line of .130/.205/.165, and a strikeout rate of 30.7%. They have a combined 15 hits and 11 walks since May 1. 3. Brewers — 41.4–26.5 (.610) ⬆️ Biggest Weekly Storyline: On Friday, Jacob Misiorowski began the game by throwing the fastest pitch ever recorded by a starting pitcher (104.5 mph). His final line: 15 strikeouts, 1 hit allowed, 0 walks, 0 runs on 95 pitches. He faced the minimum across nine innings, as his lone hit allowed in the fourth inning was erased by a double play. 4. Braves — 42.6–27.4 (.609) ⬇️ Biggest Weekly Storyline: The Braves put Ronald Acuña Jr. on the 10-day injured list with a left hamstring strain. It is Acuña’s second left hamstring injury this season. 5. Pirates — 39.4–31.5 (.556) Biggest Weekly Storyline: Evan Sisk has been a breakout player for the Pirates. The left-hander has a 1.29 ERA and 2.54 FIP with 36 strikeouts in 23 games in 2026. 6. Marlins — 38.9–32.1 (.548) ⬆️ Biggest Weekly Storyline: Sandy Alcantara became the fifth active Dominican-born pitcher to reach 1,000 K's. He joins Luis Castillo, Freddy Peralta, Luis Severino, and Framber Valdez. 7. Mariners — 38.7–33.3 (.538) Biggest Weekly Storyline: Mariners starter Bryce Miller has coaxed five double plays this season in 35 innings, matching his 2025 total in 90 1/3 innings and just one shy of his 2024 total in 180 1/3 innings. 8. Cubs — 38.1–32.9 (.537) ⬇️ Biggest Weekly Storyline: Ben Brown has an impressive 1.44 ERA across 31 1/3 innings pitched since moving to the rotation. That ERA since May 8 is the sixth-lowest in baseball, only behind Jacob Misiorowski (0.23 ERA), Cristopher Sanchez (0.24 ERA), Shohei Ohtani (0.37 ERA), Kyle Harrison (0.90 ERA), and Bryce Miller (1.33 ERA). 9. Rays — 35.4–31.8 (.527) Biggest Weekly Storyline: Drew Rasmussen recorded a career-high 13 Ks as he struck out the Red Sox's top three batters three times each in win. His previous career high was 10 Ks back in 2022. 10. Blue Jays — 36.7–34.3 (.517) ⬆️ Biggest Weekly Storyline: Alejandro Kirk got three hits in his return from the 60-day IL after recovering from a left thumb fracture. He reached base four times and drove in two runs as the Blue Jays beat the Yankees. 11. Rangers — 35.9–34.1 (.513) Biggest Weekly Storyline: Corey Seager has had yet another injury-riddled season to start his 2026 campaign. He had a scary home plate collision on Thursday and has pain in his jaw and ribs. 12. White Sox — 35.0–34.0 (.507) ⬆️ Biggest Weekly Storyline: Outfielder Braden Montgomery became just the fifth player in MLB history to hit a walk-off home run in their debut since 1900. The other players on that list? Carlos Perez (2015), Miguel Cabrera (2003), Josh Bard (2002), and Billy Parker (1971). 13. Cardinals — 34.5–33.5 (.507) ⬆️ Biggest Weekly Storyline: Infielder Blaze Jordan forced the Cardinals' to call him up. The 23-year-old corner was slashing .313/.373/.548 with 11 home runs, 35 RBIs and a .921 OPS in 57 games. 14. Guardians — 35.9–36.1 (.499) ⬇️ Biggest Weekly Storyline: The Guardians lost All-Star third baseman Jose Ramirez to the IL with a fractured left hamate bone. Injuries like this can take six to eight weeks to heal after surgery. 15. Red Sox — 33.4–34.6 (.491) Biggest Weekly Storyline: Closer Aroldis Chapman was on a podcast this week and said if Yankees trade for him that general manager Brian Cashman should apologize first. He missed a workout and was left off New York’s 2022 ALDS roster. 16. Tigers — 34.7–36.3 (.489) ⬆️ Biggest Weekly Storyline: Reigning AL Cy Young winner Tarik Skubal returned to the mound on Saturday just 38 days after having surgery on his left elbow. He allowed three runs (two earned) in 4 2/3 innings with four strikeouts and one walk. 17. Nationals — 34.6–36.4 (.487) ⬇️ Biggest Weekly Storyline: At just 23-years-old, James Wood might be the NL’s best overall hitter. He currently has the 4th highest barrel rate in the Statcast Era, trailing only three historic Aaron Judge seasons (2017, 2022, 2024). 18. Angels — 33.9–37.1 (.477) ⬆️ Biggest Weekly Storyline: Mike Trout hit his 1,000th single of his career this week. The future Hall of Famer has over 1800 career hits. He leads the AL in walks and runs this season. 19. Diamondbacks — 33.0–37.0 (.471) Biggest Weekly Storyline: Outfielder Jordan Lawlar returned from a two-month stay on the IL. In his first game back he made a terrific catch in the outfield, reached base three times, stole a pair of bases and delivered a two-run single to cap the Diamondbacks’ scoring in a tiebreaking, three-run ninth inning. 20. Athletics — 32.6–37.4 (.466) ⬆️ Biggest Weekly Storyline: The A's activate shortstop Jacob Wilson and placed DH Brent Rooker on injured list with a left knee bruise. Wilson had missed a month with a dislocated left shoulder. 21. Orioles — 33.5–38.5 (.465) ⬆️ Biggest Weekly Storyline: Gunnar Henderson hit his 100th career home run on Friday night. He became the fifth O’s player to reach 100 for the club before turning 25, including Manny Machado, Eddie Murray, Cal Ripken Jr., and Boog Powell. 22. Phillies — 32.3–37.7 (.461) ⬇️ Biggest Weekly Storyline: Zack Wheeler didn’t allow a hit to the Padres until sixth, and finished with seven innings by allowing two runs and striking out eight. In the same game, the Phillies cleared the 4-run threshold for the first time since May 18. 23. Astros — 32.5–39.5 (.451) ⬆️ Biggest Weekly Storyline: Astros slugger Yordan Alvarez became the first MLB player to hit a grand slam and multi-run home runs in the 1st inning on Friday night. He's currently leads the AL in homers. 24. Mets — 31.2–38.9 (.445) ⬆️ Biggest Weekly Storyline: Bo Bichette had two homers including a grand slam as he drove in six runs to lead Mets past Braves 7-5. 25. Royals — 31.2–39.9 (.439) ⬇️ Biggest Weekly Storyline: Starting pitcher Seth Lugo was forced to leave Wednesday’s contest early after taking a 107-mph line drive off his forehead. The team reports he is “doing well” but he’s had to go on the 7-day concussion IL. 26. Twins — 31.0–41.1 (.430) ⬇️ Biggest Weekly Storyline: Minnesota made a tremendous comeback on Friday night. Kody Clemens hit a three-run bomb in the seventh inning. Then Royce Lewis and Brooks Lee hit solo shots in the bottom of the ninth to put the Twins up for good. 27. Padres — 29.5–39.5 (.428) ⬆️ Biggest Weekly Storyline: The Padres have lost 13 of their last 18 games. San Diego ranks at the bottom of baseball in batting average, on-base percentage, slugging percentage, and runs scored. 28. Reds — 26.8–42.3 (.388) ⬆️ Biggest Weekly Storyline: Tejay Antone has been a surprise contributor to the Reds bullpen. After three arm surgeries, he returned to the big-leagues and has registered a save, 14 strikeouts, four walks, and a 1.14 WHIP in 14 innings. 29. Rockies — 25.2–45.8 (.355) ⬆️ Biggest Weekly Storyline: Hunter Goodman, Cole Carrigg, and TJ Rumfield are giving Rockies fans something to be excited about. This young trio fueled a Rockies' series win over Cubs. 30. Giants — 32.8–38.2 (.462) ⬇️ Biggest Weekly Storyline: San Francisco should be higher on this list based solely on its projected record, but the Giants have earned a spot at the bottom. The organization hosted Pride Night on Friday, with players wearing rainbow-themed SF caps as part of the celebration. On a night intended to recognize and support the LGBTQ+ community—a significant part of both the fan base and the city itself—the focus instead shifted to a message that many viewed as exclusionary. Four of the Giants' five pitchers made statements regarding the team's choice of headwear. Landen Roupp, JT Brubaker , and Ryan Walker wrote Genesis 9:11-16 on their caps, a passage that references God's covenant symbolized by the rainbow. In recent years, some Christians have cited the verse while arguing that the rainbow is exclusively a religious symbol and that its use in Pride imagery represents an appropriation of something sacred. Meanwhile, Sam Hentges chose not to wear the rainbow cap at all. The Giants went on to lose 5-1 and now sit 14 games under .500 with the National League's second-worst record. Giants fans deserve better than having a celebration intended to unite the community overshadowed by controversy. What storylines stood out this week? Do you agree with the rankings above? Leave a comment and start the discussion. View full article
-
Image courtesy of © Sam Navarro-Imagn Images One of the clearest themes emerging this week is the National League’s grip on the top of the sport. Four of the top five teams in these rankings come from the NL, with the Yankees standing as the lone American League representative among baseball’s elite. The Braves, Dodgers, Cubs, and Brewers have all paired strong records with underlying numbers that suggest their success is built on more than just a hot stretch. That is why third-order wins remain such a useful lens for evaluating the league. Based on Clay Davenport’s adjusted standings, the metric goes beyond wins and losses by factoring in run differential, quality of competition, and ballpark effects. The goal is to identify which teams are genuinely playing the best baseball rather than simply riding favorable sequencing or a soft portion of the schedule. The separation is becoming more pronounced as June moves along. While the NL’s contenders continue to strengthen their position, several clubs near the bottom of these rankings entered the season expecting to compete for playoff spots and are already running short on runway. Teams like the Astros, Mets, and Royals still have time to recover, but the margin for error is shrinking quickly as the standings begin to harden into something more meaningful than an early-season snapshot. These rankings are built to highlight sustainable performance over temporary momentum. The arrows below show which teams are trending upward, slipping backward, or holding steady as the postseason race slowly starts to take shape. 1. Dodgers — 45.7–19.2 (.704) Biggest Weekly Storyline: The Dodgers have a +126 run differential through 60 games. Seven of the nine teams with a better run differential at that point in a season reached the World Series and five won it. 2. Yankees — 40.1–22.8 (.638) Biggest Weekly Storyline: Aaron Judge played with a fractured rib since April 27th and aggravated when he hit the wall to make a catch on May 3rd. He is expected to miss four-six weeks. 3. Braves — 40.3–24.7 (.620) Biggest Weekly Storyline: Atlanta’s .697 road winning percentage is MLB’s best this season. It’s also the third-best in the Integration Era (since 1947), trailing only the .728 mark of the 2001 Mariners and the .704 mark of the 2018 Astros. 4. Brewers — 38.3–23.6 (.619) Biggest Weekly Storyline: Jacob Misiorowski (rightfully) gets a lot of attention in Milwaukee’s rotation. However, Kyle Harrison has been nearly as good. In 11 games, he has a 1.57 ERA, 1.03 WHIP, and 2.7 WAR. 5. Pirates — 36.1–28.9 (.555) ⬆️ Biggest Weekly Storyline: The Pirates placed rookie shortstop Konnor Griffin on the 10-day injured list due to a right elbow strain. He has been streaky to start his big-league career but has a .729 OPS. 6. Cubs — 35.3–29.7 (.543) ⬇️ Biggest Weekly Storyline: In one game, Pete Crow-Armstrong allowed an inside-the-park home run after losing a ball in the lights before hitting a walk-off homer in the ninth. It was his 50th career home run. 7. Mariners — 35.2–29.7 (.542) ⬆️ Biggest Weekly Storyline: Seattle’s starters get a lot of attention, but their bullpen has been a strength this year. The bullpen ranks first in MLB in inherited runners scored, second in MLB in ERA, and HR/9. 8. Marlins — 34.5–30.5 (.531) ⬆️ Biggest Weekly Storyline: Max Meyer finished Wednesday’s start with seven innings while only giving up one run on two hits, walking two, and striking out seven. Meyer even tied a club record by going 13 consecutive starts without a loss. 9. Rays — 32.2–28.8 (.528) ⬇️ Biggest Weekly Storyline: Drew Rasmussen allowed one hit in seven dominant innings on Friday. He struck out a season-high nine and retired 17 straight after allowing an opposite-field single to right in the second. 10. Nationals — 33.4–31.6 (.514) ⬆️ Biggest Weekly Storyline: Luis García Jr. hit his first career grand slam for his second homer of the game as part of a five-homer effort for the Nationals on Friday. 11. Rangers — 32.7–31.3 (.511) ⬇️ Biggest Weekly Storyline: Corey Seager returned from the IL and hit a two-run homer in his first game back. Seager had missed 19 games since May 13 while on the injured list because of lower back inflammation. 12. Blue Jays — 33.1–31.9 (.509) ⬇️ Biggest Weekly Storyline: Chad Dallas got his MLB debut call on Lou Gehrig Day, which is even more meaningful for him since his father died from ALS. In his debut, he pitched 3 2/3 innings while allowing just one run on two hits, walking two and striking out two. 13. Guardians — 33.5–32.5 (.508) ⬆️ Biggest Weekly Storyline: The Guardians won a series against the Yankees in New York. This included taking games from early Cy Young candidate Cam Schlittler and Gerrit Cole. 14. White Sox — 32.3–31.7 (.505) ⬆️ Biggest Weekly Storyline: Munetaka Murakami’s monster May earned him AL Rookie of the Month honors. However, he is currently on the IL with a hamstring injury. 15. Red Sox — 31.1–30.9 (.502) ⬇️ Biggest Weekly Storyline: Aroldis Chapman is just seven strikeouts away from passing Hoyt Wilhelm and securing the No. 1 spot on the all-time strikeout list for relievers. Craig Kimbrel and Kenley Jansen are the only other active pitchers in the top 10. 16. Cardinals — 30.8–31.2 (.497) ⬆️ Biggest Weekly Storyline: Outfielder Lars Nootbaar was activated from the 60-day injured list on Friday after having had surgery on both of his heels in the offseason. In his first game, he had two hits, a double, an RBI, a run scored and a running catch in left field. 17. Tigers — 31.7–33.3 (.488) ⬆️ Biggest Weekly Storyline: Two-time AL Cy Young winner Tarik Skubal made a rehab start on Sunday and is expected to rejoin the Tigers rotation later this week. Detroit is well out of the race, so his return is more about showcasing himself for a potential trade. 18. Diamondbacks — 30.1–33.9 (.470) ⬇️ Biggest Weekly Storyline: Corbin Burnes has a right lat injury that will sideline him from throwing activities in his recovery from last year's Tommy John surgery. He has only made 11 starts for Arizona since signing the richest contract in franchise history (six years, $210 million). 19. Giants — 30.3–34.8 (.465) ⬆️ Biggest Weekly Storyline: The Giants scored 30 runs in two games this week. It was their most in any two-game span since 1944, which was 14 years before the team moved to San Francisco. 20. Astros — 30.4–35.7 (.460) ⬆️ Biggest Weekly Storyline: The Astros activated Josh Hader after the star closer missed the start of the 2026 season due to biceps injury. 21. Phillies — 29.4–34.6 (.459) ⬇️ Biggest Weekly Storyline: Zack Wheeler didn’t allow a hit to the Padres until the sixth, and finished with seven innings by allowing two runs and striking out eight. In the same game, the Phillies cleared the 4-run threshold for the first time since May 18. 22. Orioles — 29.6–35.5 (.455) ⬆️ Biggest Weekly Storyline: Trevor Rogers had a bounce-back start against Boston after the Orioles had lost seven straight games with Rogers on the mound. He allowed just one run in 5 2/3 innings of work. 23. Twins — 29.3–36.7 (.444) ⬇️ Biggest Weekly Storyline: The Twins recalled Royce Lewis after his recent demotion to Triple-A for a reset. In 15 games and across 60 at-bats, Lewis had a .333 batting average with a 1.303 OPS. 24. Royals — 28.8–36.2 (.443) ⬆️ Biggest Weekly Storyline: Josh Rojas played at Triple-A and the MLB level on the same day. He went 1-for-3 at Triple-A before being called up on Thursday. Because of a rain delay, he arrived in the eighth inning and hit the game-winning two-run single in the top of the ninth. 25. Angels — 28.8–36.2 (.443) ⬇️ Biggest Weekly Storyline: Reid Detmers held the Dodgers to two hits over six shutout innings on Friday. Over his last three starts, Detmers has allowed just four runs on eight hits and five walks while racking up 27 strikeouts across 19 innings. 26. Mets — 28.2–35.8 (.441) ⬆️ Biggest Weekly Storyline: In a disappointing season, Christian Scott’s reemergence is among the Mets’ most positive developments. On Friday, he pitched 5 2/3 scoreless innings, allowing three hits and two walks as his ERA dropped to 2.50. 27. Athletics — 28.0–36.0 (.438) ⬇️ Biggest Weekly Storyline: The team elected to designate former closer Joel Kuhnel for assignment. Over his last seven appearances, he posted a brutal ERA of 7.88 in eight innings pitched. 28. Padres — 27.5–35.5 (.437) ⬇️ Biggest Weekly Storyline: The Padres designated Nick Castellanos for assignment after he hit .191 with the team. San Diego also dropped 10 spots in the ranking compared to last week. 29. Reds — 24.5–38.5 (.389) Biggest Weekly Storyline: Hunter Greene, who has been out the entire season, is set to begin throwing live batting practice. There’s a chance he makes a couple of starts before the All-Star break. 30. Rockies — 22.8–42.3 (.350) Biggest Weekly Storyline: Troy Johnston’s .320 batting average is fifth-best in all of MLB, and is the highest a Rockies player has had on June 5 since Nolan Arenado hit .343 in 2019. What storylines stood out this week? Do you agree with the rankings above? Leave a comment and start the discussion. View full article
-
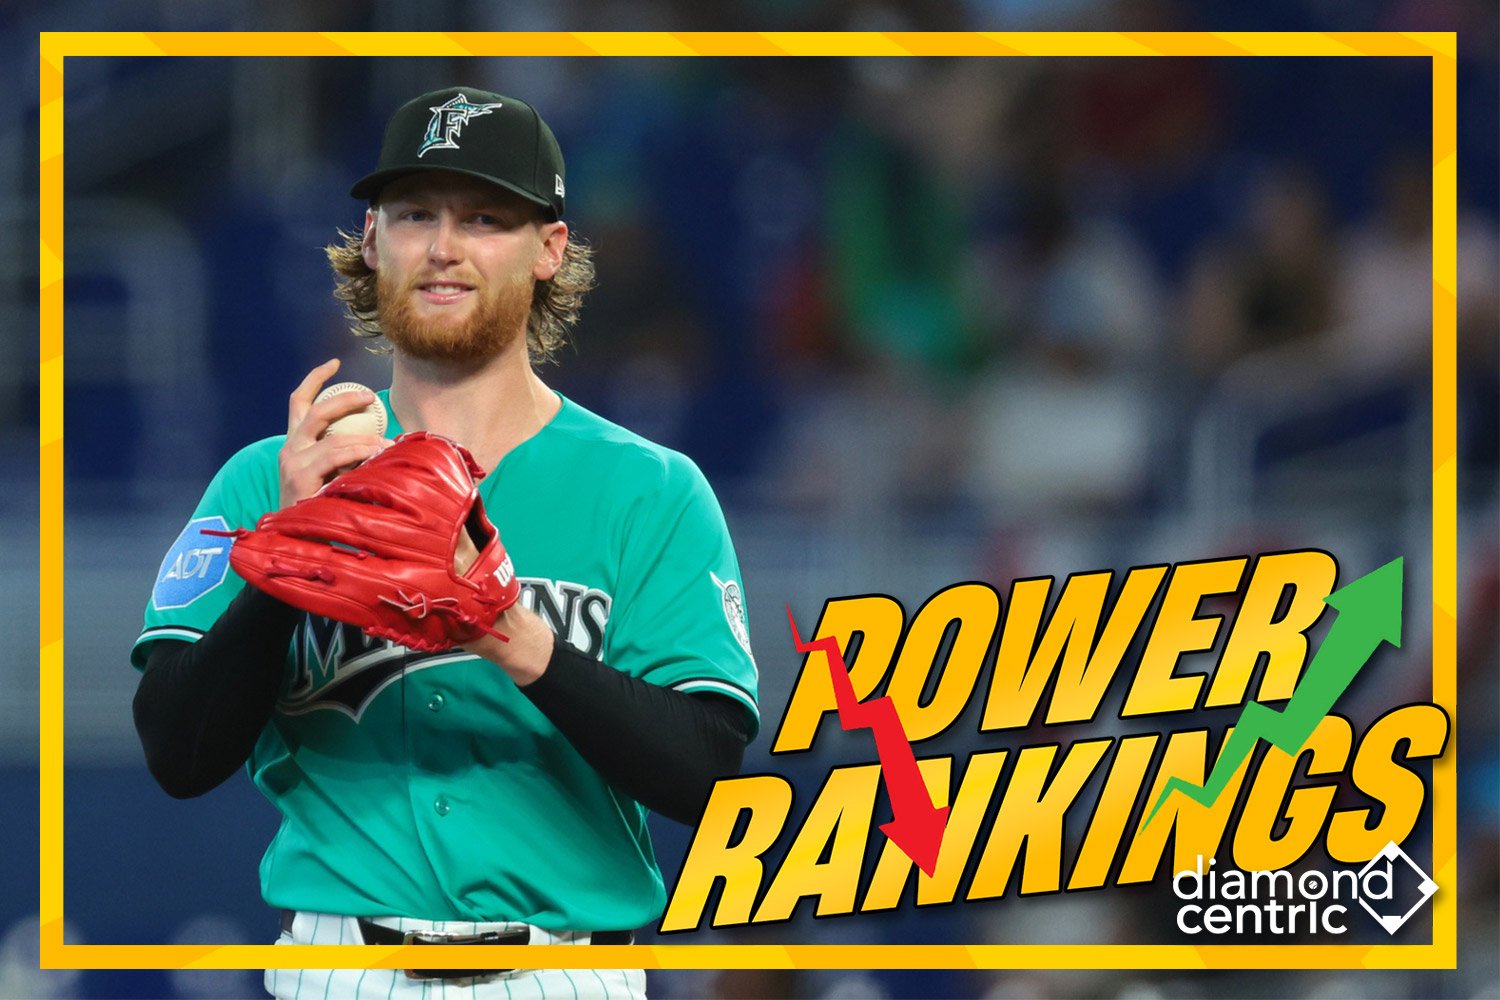 One of the clearest themes emerging this week is the National League’s grip on the top of the sport. Four of the top five teams in these rankings come from the NL, with the Yankees standing as the lone American League representative among baseball’s elite. The Braves, Dodgers, Cubs, and Brewers have all paired strong records with underlying numbers that suggest their success is built on more than just a hot stretch. That is why third-order wins remain such a useful lens for evaluating the league. Based on Clay Davenport’s adjusted standings, the metric goes beyond wins and losses by factoring in run differential, quality of competition, and ballpark effects. The goal is to identify which teams are genuinely playing the best baseball rather than simply riding favorable sequencing or a soft portion of the schedule. The separation is becoming more pronounced as June moves along. While the NL’s contenders continue to strengthen their position, several clubs near the bottom of these rankings entered the season expecting to compete for playoff spots and are already running short on runway. Teams like the Astros, Mets, and Royals still have time to recover, but the margin for error is shrinking quickly as the standings begin to harden into something more meaningful than an early-season snapshot. These rankings are built to highlight sustainable performance over temporary momentum. The arrows below show which teams are trending upward, slipping backward, or holding steady as the postseason race slowly starts to take shape. 1. Dodgers — 45.7–19.2 (.704) Biggest Weekly Storyline: The Dodgers have a +126 run differential through 60 games. Seven of the nine teams with a better run differential at that point in a season reached the World Series and five won it. 2. Yankees — 40.1–22.8 (.638) Biggest Weekly Storyline: Aaron Judge played with a fractured rib since April 27th and aggravated when he hit the wall to make a catch on May 3rd. He is expected to miss four-six weeks. 3. Braves — 40.3–24.7 (.620) Biggest Weekly Storyline: Atlanta’s .697 road winning percentage is MLB’s best this season. It’s also the third-best in the Integration Era (since 1947), trailing only the .728 mark of the 2001 Mariners and the .704 mark of the 2018 Astros. 4. Brewers — 38.3–23.6 (.619) Biggest Weekly Storyline: Jacob Misiorowski (rightfully) gets a lot of attention in Milwaukee’s rotation. However, Kyle Harrison has been nearly as good. In 11 games, he has a 1.57 ERA, 1.03 WHIP, and 2.7 WAR. 5. Pirates — 36.1–28.9 (.555) ⬆️ Biggest Weekly Storyline: The Pirates placed rookie shortstop Konnor Griffin on the 10-day injured list due to a right elbow strain. He has been streaky to start his big-league career but has a .729 OPS. 6. Cubs — 35.3–29.7 (.543) ⬇️ Biggest Weekly Storyline: In one game, Pete Crow-Armstrong allowed an inside-the-park home run after losing a ball in the lights before hitting a walk-off homer in the ninth. It was his 50th career home run. 7. Mariners — 35.2–29.7 (.542) ⬆️ Biggest Weekly Storyline: Seattle’s starters get a lot of attention, but their bullpen has been a strength this year. The bullpen ranks first in MLB in inherited runners scored, second in MLB in ERA, and HR/9. 8. Marlins — 34.5–30.5 (.531) ⬆️ Biggest Weekly Storyline: Max Meyer finished Wednesday’s start with seven innings while only giving up one run on two hits, walking two, and striking out seven. Meyer even tied a club record by going 13 consecutive starts without a loss. 9. Rays — 32.2–28.8 (.528) ⬇️ Biggest Weekly Storyline: Drew Rasmussen allowed one hit in seven dominant innings on Friday. He struck out a season-high nine and retired 17 straight after allowing an opposite-field single to right in the second. 10. Nationals — 33.4–31.6 (.514) ⬆️ Biggest Weekly Storyline: Luis García Jr. hit his first career grand slam for his second homer of the game as part of a five-homer effort for the Nationals on Friday. 11. Rangers — 32.7–31.3 (.511) ⬇️ Biggest Weekly Storyline: Corey Seager returned from the IL and hit a two-run homer in his first game back. Seager had missed 19 games since May 13 while on the injured list because of lower back inflammation. 12. Blue Jays — 33.1–31.9 (.509) ⬇️ Biggest Weekly Storyline: Chad Dallas got his MLB debut call on Lou Gehrig Day, which is even more meaningful for him since his father died from ALS. In his debut, he pitched 3 2/3 innings while allowing just one run on two hits, walking two and striking out two. 13. Guardians — 33.5–32.5 (.508) ⬆️ Biggest Weekly Storyline: The Guardians won a series against the Yankees in New York. This included taking games from early Cy Young candidate Cam Schlittler and Gerrit Cole. 14. White Sox — 32.3–31.7 (.505) ⬆️ Biggest Weekly Storyline: Munetaka Murakami’s monster May earned him AL Rookie of the Month honors. However, he is currently on the IL with a hamstring injury. 15. Red Sox — 31.1–30.9 (.502) ⬇️ Biggest Weekly Storyline: Aroldis Chapman is just seven strikeouts away from passing Hoyt Wilhelm and securing the No. 1 spot on the all-time strikeout list for relievers. Craig Kimbrel and Kenley Jansen are the only other active pitchers in the top 10. 16. Cardinals — 30.8–31.2 (.497) ⬆️ Biggest Weekly Storyline: Outfielder Lars Nootbaar was activated from the 60-day injured list on Friday after having had surgery on both of his heels in the offseason. In his first game, he had two hits, a double, an RBI, a run scored and a running catch in left field. 17. Tigers — 31.7–33.3 (.488) ⬆️ Biggest Weekly Storyline: Two-time AL Cy Young winner Tarik Skubal made a rehab start on Sunday and is expected to rejoin the Tigers rotation later this week. Detroit is well out of the race, so his return is more about showcasing himself for a potential trade. 18. Diamondbacks — 30.1–33.9 (.470) ⬇️ Biggest Weekly Storyline: Corbin Burnes has a right lat injury that will sideline him from throwing activities in his recovery from last year's Tommy John surgery. He has only made 11 starts for Arizona since signing the richest contract in franchise history (six years, $210 million). 19. Giants — 30.3–34.8 (.465) ⬆️ Biggest Weekly Storyline: The Giants scored 30 runs in two games this week. It was their most in any two-game span since 1944, which was 14 years before the team moved to San Francisco. 20. Astros — 30.4–35.7 (.460) ⬆️ Biggest Weekly Storyline: The Astros activated Josh Hader after the star closer missed the start of the 2026 season due to biceps injury. 21. Phillies — 29.4–34.6 (.459) ⬇️ Biggest Weekly Storyline: Zack Wheeler didn’t allow a hit to the Padres until the sixth, and finished with seven innings by allowing two runs and striking out eight. In the same game, the Phillies cleared the 4-run threshold for the first time since May 18. 22. Orioles — 29.6–35.5 (.455) ⬆️ Biggest Weekly Storyline: Trevor Rogers had a bounce-back start against Boston after the Orioles had lost seven straight games with Rogers on the mound. He allowed just one run in 5 2/3 innings of work. 23. Twins — 29.3–36.7 (.444) ⬇️ Biggest Weekly Storyline: The Twins recalled Royce Lewis after his recent demotion to Triple-A for a reset. In 15 games and across 60 at-bats, Lewis had a .333 batting average with a 1.303 OPS. 24. Royals — 28.8–36.2 (.443) ⬆️ Biggest Weekly Storyline: Josh Rojas played at Triple-A and the MLB level on the same day. He went 1-for-3 at Triple-A before being called up on Thursday. Because of a rain delay, he arrived in the eighth inning and hit the game-winning two-run single in the top of the ninth. 25. Angels — 28.8–36.2 (.443) ⬇️ Biggest Weekly Storyline: Reid Detmers held the Dodgers to two hits over six shutout innings on Friday. Over his last three starts, Detmers has allowed just four runs on eight hits and five walks while racking up 27 strikeouts across 19 innings. 26. Mets — 28.2–35.8 (.441) ⬆️ Biggest Weekly Storyline: In a disappointing season, Christian Scott’s reemergence is among the Mets’ most positive developments. On Friday, he pitched 5 2/3 scoreless innings, allowing three hits and two walks as his ERA dropped to 2.50. 27. Athletics — 28.0–36.0 (.438) ⬇️ Biggest Weekly Storyline: The team elected to designate former closer Joel Kuhnel for assignment. Over his last seven appearances, he posted a brutal ERA of 7.88 in eight innings pitched. 28. Padres — 27.5–35.5 (.437) ⬇️ Biggest Weekly Storyline: The Padres designated Nick Castellanos for assignment after he hit .191 with the team. San Diego also dropped 10 spots in the ranking compared to last week. 29. Reds — 24.5–38.5 (.389) Biggest Weekly Storyline: Hunter Greene, who has been out the entire season, is set to begin throwing live batting practice. There’s a chance he makes a couple of starts before the All-Star break. 30. Rockies — 22.8–42.3 (.350) Biggest Weekly Storyline: Troy Johnston’s .320 batting average is fifth-best in all of MLB, and is the highest a Rockies player has had on June 5 since Nolan Arenado hit .343 in 2019. What storylines stood out this week? Do you agree with the rankings above? Leave a comment and start the discussion.
 -
MLB Owners May Finally Be Offering The Framework Baseball Needs
Cody Christie posted an article in MLB
 For decades, Major League Baseball's labor battles have followed a familiar script. Owners push for cost certainty. Players fight to preserve earning power. Fans are left wondering why a sport that generates billions of dollars annually cannot devise a system that feels fair for everyone involved. The owners' opening proposal for a new Collective Bargaining Agreement has already drawn fierce resistance from the MLB Players Association. That's not surprising. The proposal includes the two words that have triggered labor warfare throughout baseball history: salary cap. But if we strip away the emotional baggage attached to those words and look at the proposal's broader framework, there is an argument that MLB owners may be closer to the right solution than many people want to admit. The fundamental reality is simple. Players deserve to get paid. Baseball needs more parity. A system that guarantees players a fixed percentage of revenue while forcing low spending teams to invest more in their rosters addresses both concerns. Honestly, what else could a reasonable person want? The centerpiece of MLB's proposal is a 50-50 split of league revenue between owners and players. That concept alone deserves serious consideration. According to MLB, league revenues have grown 247% since 2003 while player payroll has increased only 149% during the same period. Whether you agree with every number presented by ownership, the broader point is difficult to ignore. If baseball revenues continue climbing, players should directly participate in that growth. A fixed percentage model removes much of the annual fighting over whether owners are spending enough. If revenues rise, player compensation rises. If revenues fall, both sides share the burden. That seems significantly more logical than the current system, where payroll growth often lags far behind revenue growth. The second major component is the proposed salary floor of $171.2 million. This may be the most important aspect of the entire proposal. For years, fans have watched teams slash payrolls, trade away stars, and spend multiple seasons rebuilding while collecting revenue-sharing checks. The sport has struggled to explain why some franchises routinely spend more than $300 million while others operate at a fraction of that figure. Under MLB's proposal, 12 clubs would need to increase payroll immediately, adding a combined $617 million into player salaries. That is real money flowing directly to players. More importantly, it creates pressure on every franchise to actually try. One of the union's strongest arguments has always been that certain owners are content collecting revenue-sharing money while fielding non-competitive teams. A meaningful salary floor directly attacks that problem. If a club must spend $171 million every year, tanking becomes significantly more expensive. The part of the proposal generating the most outrage is the salary cap. The MLBPA's concerns are understandable. Baseball's history with salary cap discussions is ugly. The 1994-95 strike remains one of the darkest chapters in the sport's history. Players also have legitimate concerns that caps eventually become tools that owners use to suppress salaries. The union is also correct that a cap by itself does not guarantee competitive balance. Poorly run organizations can still make bad decisions. Smart organizations can still outperform wealthier rivals. Yet focusing exclusively on the cap risks ignoring the broader package. A salary floor without a cap would likely face overwhelming opposition from ownership. Likewise, a cap without a floor would be unacceptable for players. The question is whether a system that combines both elements while guaranteeing players half of all league revenue creates enough benefits to justify the compromise. Another part of the proposal deserves attention: media revenue reform. MLB wants to centralize local media revenue and distribute it equally among all 30 clubs. Beyond potentially helping solve blackout issues that have frustrated fans for years, this would reduce some of the financial disparity between large and small markets. The current revenue-sharing system has often created tension because players believe it discourages teams from maximizing revenue and investing in their rosters. A more centralized media model could help address that concern while creating a stronger national product. None of this means the owners' proposal is perfect. Opening offers rarely are. The cap number will be debated extensively. Players will push for stronger protections. Both sides will spend months arguing over details. That is how collective bargaining works. But for all the immediate outrage, the framework itself contains several ideas baseball desperately needs. The sport needs players to share more directly in revenue growth. The sport needs a meaningful salary floor that forces every team to invest in winning. The sport needs a better solution to local media revenue disparities. The sport needs stronger competitive balance. Those goals should not be controversial. As negotiations continue, the conversation should move beyond whether baseball can ever accept the words "salary cap." The more important question is whether a system that guarantees players half of all revenue while forcing every franchise to spend can create a healthier sport. Ironically, after years of criticism directed toward ownership, this may be one labor fight where the owners are starting from a stronger position. If they remain committed to revenue sharing reform, a substantial salary floor, and a guaranteed percentage of league revenue for players, they can credibly argue they are trying to solve baseball's biggest structural problems. The players are right to protect their interests. They should push for the best possible deal. But if the final agreement ends up resembling this proposal's foundation, baseball may ultimately emerge stronger than it is today. What needs to change with the owner’s offer? Will players ever accept a salary cap? Leave a comment and start the discussion.
 -
For decades, Major League Baseball's labor battles have followed a familiar script. Owners push for cost certainty. Players fight to preserve earning power. Fans are left wondering why a sport that generates billions of dollars annually cannot devise a system that feels fair for everyone involved. The owners' opening proposal for a new Collective Bargaining Agreement has already drawn fierce resistance from the MLB Players Association. That's not surprising. The proposal includes the two words that have triggered labor warfare throughout baseball history: salary cap. But if we strip away the emotional baggage attached to those words and look at the proposal's broader framework, there is an argument that MLB owners may be closer to the right solution than many people want to admit. The fundamental reality is simple. Players deserve to get paid. Baseball needs more parity. A system that guarantees players a fixed percentage of revenue while forcing low spending teams to invest more in their rosters addresses both concerns. Honestly, what else could a reasonable person want? The centerpiece of MLB's proposal is a 50-50 split of league revenue between owners and players. That concept alone deserves serious consideration. According to MLB, league revenues have grown 247% since 2003 while player payroll has increased only 149% during the same period. Whether you agree with every number presented by ownership, the broader point is difficult to ignore. If baseball revenues continue climbing, players should directly participate in that growth. A fixed percentage model removes much of the annual fighting over whether owners are spending enough. If revenues rise, player compensation rises. If revenues fall, both sides share the burden. That seems significantly more logical than the current system, where payroll growth often lags far behind revenue growth. The second major component is the proposed salary floor of $171.2 million. This may be the most important aspect of the entire proposal. For years, fans have watched teams slash payrolls, trade away stars, and spend multiple seasons rebuilding while collecting revenue-sharing checks. The sport has struggled to explain why some franchises routinely spend more than $300 million while others operate at a fraction of that figure. Under MLB's proposal, 12 clubs would need to increase payroll immediately, adding a combined $617 million into player salaries. That is real money flowing directly to players. More importantly, it creates pressure on every franchise to actually try. One of the union's strongest arguments has always been that certain owners are content collecting revenue-sharing money while fielding non-competitive teams. A meaningful salary floor directly attacks that problem. If a club must spend $171 million every year, tanking becomes significantly more expensive. The part of the proposal generating the most outrage is the salary cap. The MLBPA's concerns are understandable. Baseball's history with salary cap discussions is ugly. The 1994-95 strike remains one of the darkest chapters in the sport's history. Players also have legitimate concerns that caps eventually become tools that owners use to suppress salaries. The union is also correct that a cap by itself does not guarantee competitive balance. Poorly run organizations can still make bad decisions. Smart organizations can still outperform wealthier rivals. Yet focusing exclusively on the cap risks ignoring the broader package. A salary floor without a cap would likely face overwhelming opposition from ownership. Likewise, a cap without a floor would be unacceptable for players. The question is whether a system that combines both elements while guaranteeing players half of all league revenue creates enough benefits to justify the compromise. Another part of the proposal deserves attention: media revenue reform. MLB wants to centralize local media revenue and distribute it equally among all 30 clubs. Beyond potentially helping solve blackout issues that have frustrated fans for years, this would reduce some of the financial disparity between large and small markets. The current revenue-sharing system has often created tension because players believe it discourages teams from maximizing revenue and investing in their rosters. A more centralized media model could help address that concern while creating a stronger national product. None of this means the owners' proposal is perfect. Opening offers rarely are. The cap number will be debated extensively. Players will push for stronger protections. Both sides will spend months arguing over details. That is how collective bargaining works. But for all the immediate outrage, the framework itself contains several ideas baseball desperately needs. The sport needs players to share more directly in revenue growth. The sport needs a meaningful salary floor that forces every team to invest in winning. The sport needs a better solution to local media revenue disparities. The sport needs stronger competitive balance. Those goals should not be controversial. As negotiations continue, the conversation should move beyond whether baseball can ever accept the words "salary cap." The more important question is whether a system that guarantees players half of all revenue while forcing every franchise to spend can create a healthier sport. Ironically, after years of criticism directed toward ownership, this may be one labor fight where the owners are starting from a stronger position. If they remain committed to revenue sharing reform, a substantial salary floor, and a guaranteed percentage of league revenue for players, they can credibly argue they are trying to solve baseball's biggest structural problems. The players are right to protect their interests. They should push for the best possible deal. But if the final agreement ends up resembling this proposal's foundation, baseball may ultimately emerge stronger than it is today. What needs to change with the owner’s offer? Will players ever accept a salary cap? Leave a comment and start the discussion. View full article
-
Image courtesy of © David Butler II-Imagn Images Since the calendar has flipped to June, the conversation around baseball’s best teams is beginning to change. Early-season surprises have either established themselves as legitimate contenders or started to drift back toward the pack. The standings provide a useful snapshot, but they do not always answer the bigger questions. The Braves became the first team to reach 40 wins, but does that automatically make them the sport’s top club? The Yankees welcomed Gerrit Cole back to strengthen an already talented rotation, but can that group remain healthy enough to sustain its success over the next four months? Those questions are why third-order wins remain a valuable tool when evaluating the league. Based on Clay Davenport’s adjusted standings, the metric looks beyond a team’s record by incorporating run differential, strength of schedule, and ballpark effects. Rather than focusing solely on what has happened, it attempts to identify which clubs are playing the best baseball and which may be benefiting from favorable circumstances. The result is a ranking system designed to separate sustainable performance from short-term results. Some teams continue to justify their place near the top thanks to dominant underlying metrics, while others are outperforming what their profile suggests. As the season moves deeper into June and the playoff picture slowly begins to take shape, the arrows below show which teams are rising, falling, or holding steady in this week’s rankings. 1. Dodgers — 40.7–17.2 (.703) Biggest Weekly Storyline: On Thursday, Shohei Ohtani continued to do Shohei Ohtani things. He threw six hitless innings and hit a leadoff home run to help the Dodgers beat the Rockies. 2. Yankees — 38.0–20.0 (.655) ⬆️ Biggest Weekly Storyline: Gerrit Cole has been dominant since his return from Tommy John surgery. On Thursday, he struck out 10 Royal batters without allowing a walk over 6 2/3 innings. Even more impressively, he needed just 79 pitches to record the 20 outs. 3. Braves — 37.2–21.8 (.631) ⬇️ Biggest Weekly Storyline: Chris Sale returned to Fenway Park and his four-seamer averaged 97 mph , his highest average in a game since the start of 2019. In five innings, he fanned eight hitters and allowed just two earned runs on six hits. 4. Brewers — 33.8–21.1 (.616) Biggest Weekly Storyline: On Monday, Jacob Misiorowski recorded 12 strikeouts he recorded across seven strong innings. He allowed one earned run on two hits and a walk while topping 103 mph multiple times. 5. Cubs — 33.8–25.2 (.573) ⬆️ Biggest Weekly Storyline: The Cubs had two 10-game winning streaks this season and added a 10-game losing streak this week. Thankfully for Chicago fans, Ian Happ drove in five runs on Wednesday to stop the skid. 6. Pirates — 32.8–26.2 (.556) ⬆️ Biggest Weekly Storyline: Among pitchers to debut since 1961, only Spencer Strider (4) and Paul Skenes (3) had more than two single-game streaks of 6+ consecutive strikeouts within their first 67 starts. 7. Rays — 30.4–24.6 (.553) ⬇️ Biggest Weekly Storyline: Yandy Diaz hit two home runs, including back-to-back shots with Jonathan Aranda in a seven-run seventh inning to help the Rays end a four-game losing streak. 8. Rangers — 30.9–27.1 (.533) ⬇️ Biggest Weekly Storyline: Andrew McCutchen was designated for assignment by the Rangers after 37 games. The 39-year-old was batting .192 with a home run and 5 RBI in 73 at-bats. 9. Mariners — 31.2–27.8 (.529) ⬆️ Biggest Weekly Storyline: Julio Rodriguez hit his ninth home run of May, the most he's ever hit in a single month. It had a 16-degree launch angle, a career low, but left the bat at 113.6 mph, the third-hardest homer of his career. 10. Marlins — 30.5–28.5 (.517) ⬇️ Biggest Weekly Storyline: Eury Pérez is expected to miss eight weeks with a bizarre leg injury sustained while he was stretching in the dugout. He exited Wednesday’s start in Toronto because his right hamstring spasmed while he was doing lateral lunges on the bench. 11. Blue Jays — 30.2–28.8 (.512) ⬇️ Biggest Weekly Storyline: Toronto placed starting pitcher Dylan Cease on the injured list due to a hamstring strain, but the team is hoping it will be a minimum 15-day stay on the IL. 12. Red Sox — 28.7–28.3 (.504) ⬆️ Biggest Weekly Storyline: Outfielder Roman Anthony suffered a setback during his rehab process on Thursday and is now reportedly shut down. He felt discomfort while hitting off a tee and has been shut down from swinging. 13. Nationals — 29.7–29.3 (.503) ⬆️ Biggest Weekly Storyline: The Nationals have let go of director of community relations Sean Hudson after being featured in a viral clip earlier in the week. Hudson dove into internal discussions regarding a variety of subjects. 14. Diamondbacks — 28.5–28.5 (.500) ⬇️ Biggest Weekly Storyline: Corbin Carroll saw his 13-game hitting streak end on Tuesday. During that streak, he hit over .400 with two homers, four triples, and eight RBIs. 15. White Sox — 28.5–29.5 (.491) ⬆️ Biggest Weekly Storyline: White Sox rookie Munetaka Murakami landed on IL with a hamstring strain. He is tied for the American League lead with 20 home runs. 16. Guardians — 28.7–31.4 (.478) ⬇️ Biggest Weekly Storyline: Parker Messick joined Paul Skenes and Stephen Strasburg as the only three pitchers in MLB history who have an ERA below 2.50, more than 100 strikeouts, and fewer than 30 walks through their first 18 starts. 17. Cardinals — 26.7–29.3 (.477) ⬇️ Biggest Weekly Storyline: Bryan Torres, a 28-year-old outfielder, began his minor-league career in 2015 and finally made his MLB debut. He reached base three times, first with a walk, then with a single, and, in the top of the ninth inning, he delivered a two-run home run. 18. Padres — 26.4–30.6 (.463) ⬆️ Biggest Weekly Storyline: The Padres were swept for the first time this season when the Phillies completed a three-game sweep on Wednesday. 19. Phillies — 26.7–31.3 (.460) ⬆️ Biggest Weekly Storyline: Cristopher Sánchez set the Phillies franchise record for consecutive scoreless innings. His 41 2/3 innings topped the 41-inning streak from Grover Cleveland Alexander in 1911. 20. Angels — 27.1–31.9 (.459) ⬆️ Biggest Weekly Storyline: The Angels won back-to-back series for the first time this season, sweeping Texas at home before winning two of three in Detroit. 21. Twins — 26.9–32.1 (.456) ⬇️ Biggest Weekly Storyline: In a surprising roster move, the Twins designated Simeon Woods Richardson for assignment. The 25-year-old was out of options and went 0-7 with a 7.74 ERA and a 1.89 WHIP. In 47 2/3 innings, he allowed 41 earned runs. 22. Tigers — 26.9–32.1 (.456) ⬇️ Biggest Weekly Storyline: The Tigers placed reliever Kenley Jansen on the 15-day injured list with pelvic inflammation. He left Wednesday’s game after getting two outs in the ninth inning, as it looked like he had trouble landing after each throw. 23. Astros — 27.1–32.9 (.452) ⬆️ Biggest Weekly Storyline: Spencer Arrighetti is the only pitcher in MLB history to enter June with 7+ wins, a sub-1.50 ERA, and fewer than 30 hits allowed since ERA became an official stat in 1913. 24. Orioles — 26.2–32.8 (.444) ⬆️ Biggest Weekly Storyline: Orioles' Colton Cowser hits walk-off homer two days in a row. 25. Athletics — 25.6–32.4 (.441) ⬇️ Biggest Weekly Storyline: Luis Severino left his start on Friday after the first inning with a right arm injury. He is undergoing tests to determine the severity of the injury. 26. Giants — 25.4–32.7 (.437) ⬇️ Biggest Weekly Storyline: The Giants reassign third-base coach Hector Borg to an undisclosed player development role after multiple baserunning blunders in recent weeks. 27. Royals — 24.8–33.2 (.428) ⬇️ Biggest Weekly Storyline: The Royals are struggling offensively. They are currently 29th in runs scored, 22nd in home runs, 21st in batting average, 28th in OPS, and 25th in hits. 28. Mets — 24.4–33.6 (.421) ⬇️ Biggest Weekly Storyline: MJ Melendez hit a two-run homer in the 10th inning to give the Mets a 9-7 victory over the Marlins after squandering a four-run lead Friday night. 29. Reds — 22.9–34.2 (.401) Biggest Weekly Storyline: The Reds placed reliever Graham Ashcraft on the 60-day IL with a UCL strain. It’s another blow to a bullpen that has seen its fair share of injuries. 30. Rockies — 21.5–37.5 (.364) Biggest Weekly Storyline: Ezequiel Tovar capped a five-run ninth with his second homer of the game, Hunter Goodman had a three-run shot in the same inning, as the Rockies completed a comeback against the Giants on Friday. What storylines stood out this week? Do you agree with the rankings above? Leave a comment and start the discussion. View full article
-
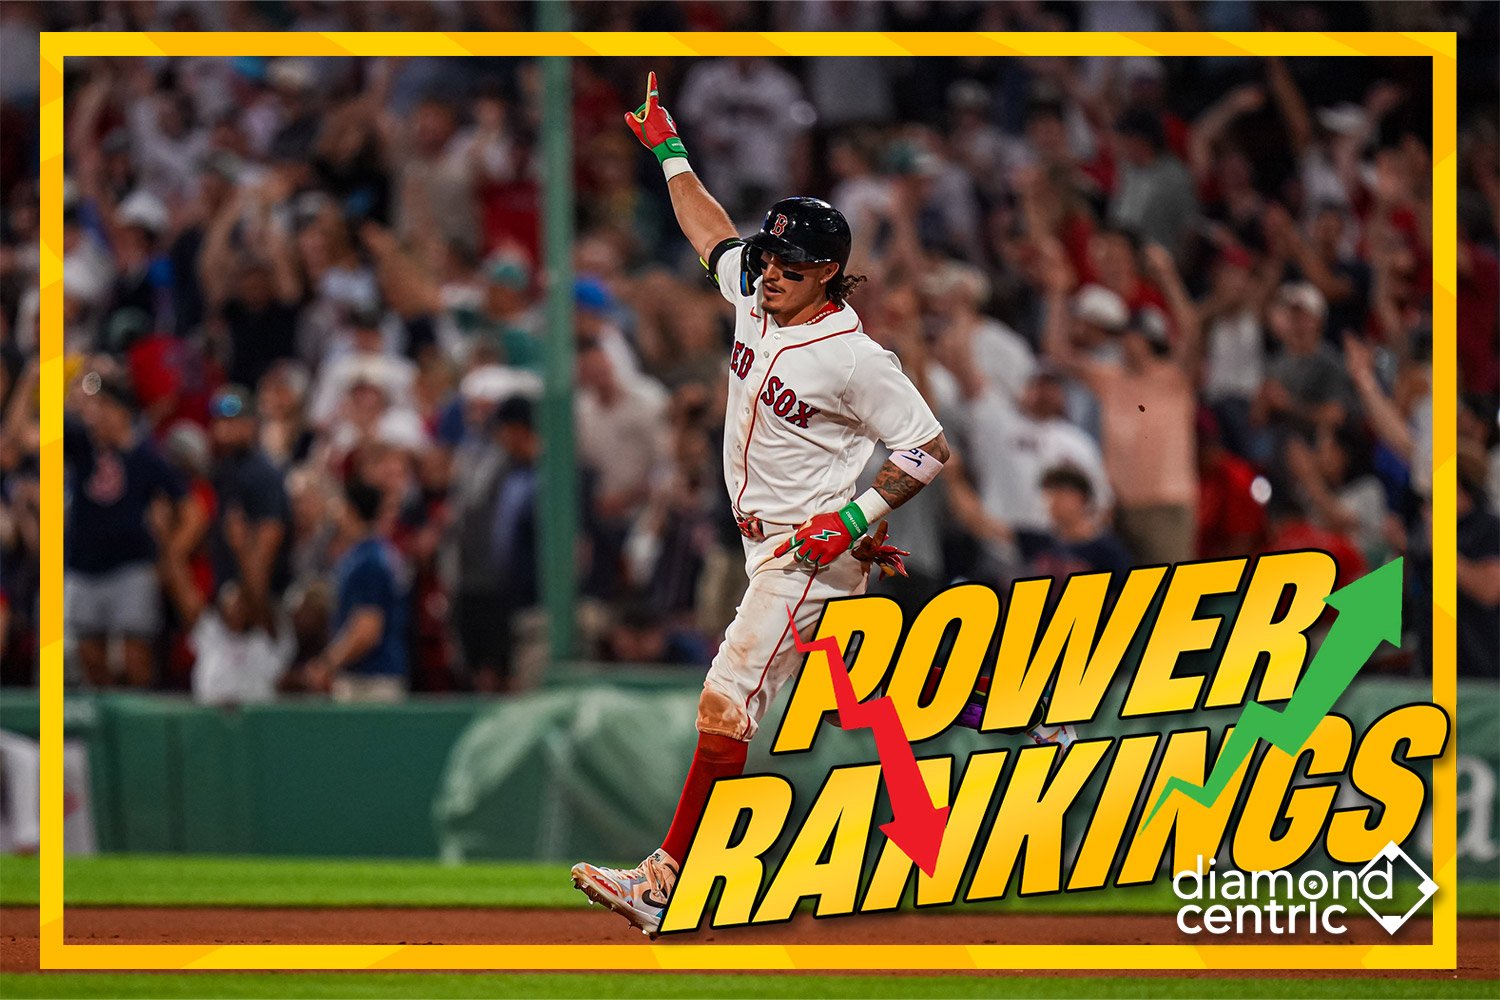 Since the calendar has flipped to June, the conversation around baseball’s best teams is beginning to change. Early-season surprises have either established themselves as legitimate contenders or started to drift back toward the pack. The standings provide a useful snapshot, but they do not always answer the bigger questions. The Braves became the first team to reach 40 wins, but does that automatically make them the sport’s top club? The Yankees welcomed Gerrit Cole back to strengthen an already talented rotation, but can that group remain healthy enough to sustain its success over the next four months? Those questions are why third-order wins remain a valuable tool when evaluating the league. Based on Clay Davenport’s adjusted standings, the metric looks beyond a team’s record by incorporating run differential, strength of schedule, and ballpark effects. Rather than focusing solely on what has happened, it attempts to identify which clubs are playing the best baseball and which may be benefiting from favorable circumstances. The result is a ranking system designed to separate sustainable performance from short-term results. Some teams continue to justify their place near the top thanks to dominant underlying metrics, while others are outperforming what their profile suggests. As the season moves deeper into June and the playoff picture slowly begins to take shape, the arrows below show which teams are rising, falling, or holding steady in this week’s rankings. 1. Dodgers — 40.7–17.2 (.703) Biggest Weekly Storyline: On Thursday, Shohei Ohtani continued to do Shohei Ohtani things. He threw six hitless innings and hit a leadoff home run to help the Dodgers beat the Rockies. 2. Yankees — 38.0–20.0 (.655) ⬆️ Biggest Weekly Storyline: Gerrit Cole has been dominant since his return from Tommy John surgery. On Thursday, he struck out 10 Royal batters without allowing a walk over 6 2/3 innings. Even more impressively, he needed just 79 pitches to record the 20 outs. 3. Braves — 37.2–21.8 (.631) ⬇️ Biggest Weekly Storyline: Chris Sale returned to Fenway Park and his four-seamer averaged 97 mph , his highest average in a game since the start of 2019. In five innings, he fanned eight hitters and allowed just two earned runs on six hits. 4. Brewers — 33.8–21.1 (.616) Biggest Weekly Storyline: On Monday, Jacob Misiorowski recorded 12 strikeouts he recorded across seven strong innings. He allowed one earned run on two hits and a walk while topping 103 mph multiple times. 5. Cubs — 33.8–25.2 (.573) ⬆️ Biggest Weekly Storyline: The Cubs had two 10-game winning streaks this season and added a 10-game losing streak this week. Thankfully for Chicago fans, Ian Happ drove in five runs on Wednesday to stop the skid. 6. Pirates — 32.8–26.2 (.556) ⬆️ Biggest Weekly Storyline: Among pitchers to debut since 1961, only Spencer Strider (4) and Paul Skenes (3) had more than two single-game streaks of 6+ consecutive strikeouts within their first 67 starts. 7. Rays — 30.4–24.6 (.553) ⬇️ Biggest Weekly Storyline: Yandy Diaz hit two home runs, including back-to-back shots with Jonathan Aranda in a seven-run seventh inning to help the Rays end a four-game losing streak. 8. Rangers — 30.9–27.1 (.533) ⬇️ Biggest Weekly Storyline: Andrew McCutchen was designated for assignment by the Rangers after 37 games. The 39-year-old was batting .192 with a home run and 5 RBI in 73 at-bats. 9. Mariners — 31.2–27.8 (.529) ⬆️ Biggest Weekly Storyline: Julio Rodriguez hit his ninth home run of May, the most he's ever hit in a single month. It had a 16-degree launch angle, a career low, but left the bat at 113.6 mph, the third-hardest homer of his career. 10. Marlins — 30.5–28.5 (.517) ⬇️ Biggest Weekly Storyline: Eury Pérez is expected to miss eight weeks with a bizarre leg injury sustained while he was stretching in the dugout. He exited Wednesday’s start in Toronto because his right hamstring spasmed while he was doing lateral lunges on the bench. 11. Blue Jays — 30.2–28.8 (.512) ⬇️ Biggest Weekly Storyline: Toronto placed starting pitcher Dylan Cease on the injured list due to a hamstring strain, but the team is hoping it will be a minimum 15-day stay on the IL. 12. Red Sox — 28.7–28.3 (.504) ⬆️ Biggest Weekly Storyline: Outfielder Roman Anthony suffered a setback during his rehab process on Thursday and is now reportedly shut down. He felt discomfort while hitting off a tee and has been shut down from swinging. 13. Nationals — 29.7–29.3 (.503) ⬆️ Biggest Weekly Storyline: The Nationals have let go of director of community relations Sean Hudson after being featured in a viral clip earlier in the week. Hudson dove into internal discussions regarding a variety of subjects. 14. Diamondbacks — 28.5–28.5 (.500) ⬇️ Biggest Weekly Storyline: Corbin Carroll saw his 13-game hitting streak end on Tuesday. During that streak, he hit over .400 with two homers, four triples, and eight RBIs. 15. White Sox — 28.5–29.5 (.491) ⬆️ Biggest Weekly Storyline: White Sox rookie Munetaka Murakami landed on IL with a hamstring strain. He is tied for the American League lead with 20 home runs. 16. Guardians — 28.7–31.4 (.478) ⬇️ Biggest Weekly Storyline: Parker Messick joined Paul Skenes and Stephen Strasburg as the only three pitchers in MLB history who have an ERA below 2.50, more than 100 strikeouts, and fewer than 30 walks through their first 18 starts. 17. Cardinals — 26.7–29.3 (.477) ⬇️ Biggest Weekly Storyline: Bryan Torres, a 28-year-old outfielder, began his minor-league career in 2015 and finally made his MLB debut. He reached base three times, first with a walk, then with a single, and, in the top of the ninth inning, he delivered a two-run home run. 18. Padres — 26.4–30.6 (.463) ⬆️ Biggest Weekly Storyline: The Padres were swept for the first time this season when the Phillies completed a three-game sweep on Wednesday. 19. Phillies — 26.7–31.3 (.460) ⬆️ Biggest Weekly Storyline: Cristopher Sánchez set the Phillies franchise record for consecutive scoreless innings. His 41 2/3 innings topped the 41-inning streak from Grover Cleveland Alexander in 1911. 20. Angels — 27.1–31.9 (.459) ⬆️ Biggest Weekly Storyline: The Angels won back-to-back series for the first time this season, sweeping Texas at home before winning two of three in Detroit. 21. Twins — 26.9–32.1 (.456) ⬇️ Biggest Weekly Storyline: In a surprising roster move, the Twins designated Simeon Woods Richardson for assignment. The 25-year-old was out of options and went 0-7 with a 7.74 ERA and a 1.89 WHIP. In 47 2/3 innings, he allowed 41 earned runs. 22. Tigers — 26.9–32.1 (.456) ⬇️ Biggest Weekly Storyline: The Tigers placed reliever Kenley Jansen on the 15-day injured list with pelvic inflammation. He left Wednesday’s game after getting two outs in the ninth inning, as it looked like he had trouble landing after each throw. 23. Astros — 27.1–32.9 (.452) ⬆️ Biggest Weekly Storyline: Spencer Arrighetti is the only pitcher in MLB history to enter June with 7+ wins, a sub-1.50 ERA, and fewer than 30 hits allowed since ERA became an official stat in 1913. 24. Orioles — 26.2–32.8 (.444) ⬆️ Biggest Weekly Storyline: Orioles' Colton Cowser hits walk-off homer two days in a row. 25. Athletics — 25.6–32.4 (.441) ⬇️ Biggest Weekly Storyline: Luis Severino left his start on Friday after the first inning with a right arm injury. He is undergoing tests to determine the severity of the injury. 26. Giants — 25.4–32.7 (.437) ⬇️ Biggest Weekly Storyline: The Giants reassign third-base coach Hector Borg to an undisclosed player development role after multiple baserunning blunders in recent weeks. 27. Royals — 24.8–33.2 (.428) ⬇️ Biggest Weekly Storyline: The Royals are struggling offensively. They are currently 29th in runs scored, 22nd in home runs, 21st in batting average, 28th in OPS, and 25th in hits. 28. Mets — 24.4–33.6 (.421) ⬇️ Biggest Weekly Storyline: MJ Melendez hit a two-run homer in the 10th inning to give the Mets a 9-7 victory over the Marlins after squandering a four-run lead Friday night. 29. Reds — 22.9–34.2 (.401) Biggest Weekly Storyline: The Reds placed reliever Graham Ashcraft on the 60-day IL with a UCL strain. It’s another blow to a bullpen that has seen its fair share of injuries. 30. Rockies — 21.5–37.5 (.364) Biggest Weekly Storyline: Ezequiel Tovar capped a five-run ninth with his second homer of the game, Hunter Goodman had a three-run shot in the same inning, as the Rockies completed a comeback against the Giants on Friday. What storylines stood out this week? Do you agree with the rankings above? Leave a comment and start the discussion.
 -
Image courtesy of © Eric Canha-Imagn Images Memorial Day weekend has long been viewed as the unofficial start of summer, and around Major League Baseball, it often marks the point where the standings begin to feel more meaningful. With May coming to a close and June right around the corner, teams are moving beyond the randomness of the season’s opening weeks. Contenders are starting to create breathing room, while others are already searching for answers before the calendar fully flips to summer. That also makes this stretch of the season difficult to evaluate at face value. A club can surge up the standings with one hot road trip while another suddenly looks vulnerable after a rough week against quality competition. Records still matter, but they do not always reflect how sustainable a team’s performance actually is beneath the surface. That is why third-order wins offer a valuable lens for these rankings. Based on Clay Davenport’s adjusted standings, the metric looks beyond wins and losses by incorporating factors like run differential, strength of schedule, and ballpark effects. The goal is to measure how teams should be performing in a more neutral environment, rather than simply rewarding recent results. The result is a set of power rankings that focus more on long-term indicators than on short-term swings. Some teams continue to back up their strong starts with dominant underlying numbers, while others are surviving on timely hitting, bullpen magic, or favorable stretches of the schedule. The arrows below track how each club has moved since last week as baseball’s hierarchy becomes clearer heading into June. 1. Dodgers — 36.0–16.0 (.692) Biggest Weekly Storyline: Shohei Ohtani lowered his sub-one ERA even further after tossing five scoreless innings and picking up four strikeouts against the Padres on Wednesday night. He also hit a leadoff homer. He’s incredible. 2. Braves — 34.1–18.9 (.643) Biggest Weekly Storyline: Drake Baldwin was placed on the injured list on Tuesday due to an oblique strain. Through 48 games, he is hitting .303/.389/.543 (.932) with 13 home runs. 3. Yankees — 33.1–18.9 (.637) Biggest Weekly Storyline: Gerrit Cole made his season debut Friday vs. the Rays, and finished with six scoreless frames. He pitched in the majors for the first time since the 2024 World Series. 4. Brewers — 30.8–18.2 (.629) ⬆️ Biggest Weekly Storyline: Jacob Misiorowski is the only pitcher within the modern era of baseball to go four starts without allowing a run or extra base hit while also striking out at least 30 batters. 5. Rays — 28.5–20.5 (.582) ⬆️ Biggest Weekly Storyline: The Rays complete their MLB-best sixth sweep of the season on Thursday. 6. Cubs — 29.7–22.3 (.571) ⬇️ Biggest Weekly Storyline: Pete Crow-Armstrong had costly defensive errors on back-to-back days as part of a five-game losing streak that pushed the Cubs out of first in the NL Central. 7. Rangers — 27.9–23.1 (.547) ⬆️ Biggest Weekly Storyline: The Rangers already have Corey Seager and Wyatt Langford on the IL, and Brandon Nimmo left a game this week with right hamstring tightness. That’s a lot of star power out of Texas’ lineup. 8. Pirates — 28.3–23.6 (.545) ⬇️ Biggest Weekly Storyline: The Pirates' bullpen is costing them games as the club has the most extra-inning losses in MLB. 9. Marlins — 28.0–25.0 (.528) Biggest Weekly Storyline: Top pitching prospect Robby Snelling will miss the rest of the 2026 season after the team announced that he will undergo Tommy John surgery on Friday. 10. Blue Jays — 26.9–25.1 (.517) ⬆️ Biggest Weekly Storyline: Trey Yesavage has the second-lowest ERA through a pitcher’s first eight regular-season starts as a member of the Blue Jays franchise. His 1.83 ERA only trails Jeff Musselman (1.48 ERA). 11. Diamondbacks — 25.9–25.1 (.508) ⬆️ Biggest Weekly Storyline: Corbin Carroll hit a walk-off single on Thursday for the club’s fifth consecutive win. 12. Guardians — 27.4–26.6 (.507) ⬆️ Biggest Weekly Storyline: Cleveland finished off a four-game sweep of the Tigers to further push themselves ahead in the AL Central. 13. Cardinals — 25.3–25.7 (.496) ⬇️ Biggest Weekly Storyline: Dustin May was supposed to provide a veteran presence for the Cardinals' rotation, but he has struggled. On Thursday, he fell apart in the sixth inning and surrendered six hits, a homer, and four earned runs while striking out seven. 14. Twins — 25.6–26.5 (.491) ⬆️ Biggest Weekly Storyline: Minnesota demoted Royce Lewis earlier this week. In 31 games this year, he slashed .163/.261/.279 (540) with only six extra-base hits. However, the team kept rolling with a sweep in Boston. 15. Mariners — 26.0–27.0 (.491) ⬇️ Biggest Weekly Storyline: The Mariners called up top prospect Colt Emerson two months after signing him to a record $95 million contract. 16. Nationals — 26.0–27.0 (.491) ⬇️ Biggest Weekly Storyline: James Wood’s inside-the-park grand slam helped the Nationals defeat the Mets on Tuesday. 17. Tigers — 25.1–26.9 (.483) ⬇️ Biggest Weekly Storyline: The Tigers have the AL’s fifth-worst playoff odds according to FanGraphs at just over 20%. Luckily, two of the teams below them play in the AL Central (White Sox, Royals). 18. Red Sox — 24.7–26.4 (.483) Biggest Weekly Storyline: Jarren Duran became the 11th player in Red Sox history to reach 35 career triples and 100 stolen bases, and the first since Carl Yastrzemski. 19. Padres — 23.7–27.3 (.465) ⬆️ Biggest Weekly Storyline: Manny Machado has a -0.2 bWAR in 47 games due to a .178 batting average and a .603 OPS. His 70 OPS+ is the worst of his career by nearly 30 points. 20. Royals — 23.9–28.1 (.460) ⬇️ Biggest Weekly Storyline: The Royals are giving away runs on the bases. They have been caught stealing 15 times, picked off seven times, and run into outs on the bases 19 times this season. 21. White Sox — 23.3–27.7 (.457) ⬇️ Biggest Weekly Storyline: Grant Taylor earned his first save earlier this week. Leading into that game, he had allowed 0 earned runs and struck out 22 over his last 14 innings. 22. Phillies — 23.7–28.4 (.455) Biggest Weekly Storyline: Kyle Schwarber is on pace for 64 home runs and seems like a lock to smash 45 or more in four of his last five seasons. 23. Athletics — 23.3–28.7 (.448) ⬆️ Biggest Weekly Storyline: Luis Severino had a tremendous start this week. He worked seven innings by allowing two earned runs on three hits, with no walks and 10 strikeouts. 24. Angels — 23.4–29.6 (.442) ⬇️ Biggest Weekly Storyline: Stories swirled this week about the deals the Angels turned down for Shohei Ohtani during his final season of team control. Monster deals with the Padres or Rays could have helped the Angels rebuild and look foolish in hindsight. 25. Giants — 22.9–29.1 (.440) ⬆️ Biggest Weekly Storyline: The Giants were swept by the Diamondbacks and fell to 10 games under .500. 26. Mets — 22.8–29.2 (.438) ⬇️ Biggest Weekly Storyline: Huascar Brazoban has a 1.78 ERA in 25.1 innings, and his 2.57 xERA is the best on the team. 27. Orioles — 21.5–29.5 (.422) ⬆️ Biggest Weekly Storyline: Jackson Holliday was activated from IL after he underwent surgery for a fractured hamate in his right hand during spring training. 28. Astros — 21.1–32.0 (.397) Biggest Weekly Storyline: Lance McCullers Jr. was scratched from his scheduled start on Tuesday and placed on the injured list with right shoulder inflammation. He is now the fourth member of Houston's opening rotation to land on the IL this season. 29. Reds — 20.3–31.8 (.390) ⬇️ Biggest Weekly Storyline: Chase Burns lowered his ERA to 1.83 after pitching six innings and limiting the Phillies to one earned run. He struck out nine and didn’t walk any. 30. Rockies — 19.2–33.9 (.362) Biggest Weekly Storyline: The Rockies placed closer Victor Vodnik to the injured list with a right elbow injury. The team described the injury as inflammation in the right ulnar nerve. What storylines stood out this week? Do you agree with the rankings above? Leave a comment and start the discussion. View full article
-
MLB Power Rankings: Twins & Blue Jays Ascending, Cubs Out of Top Five
Cody Christie posted an article in MLB
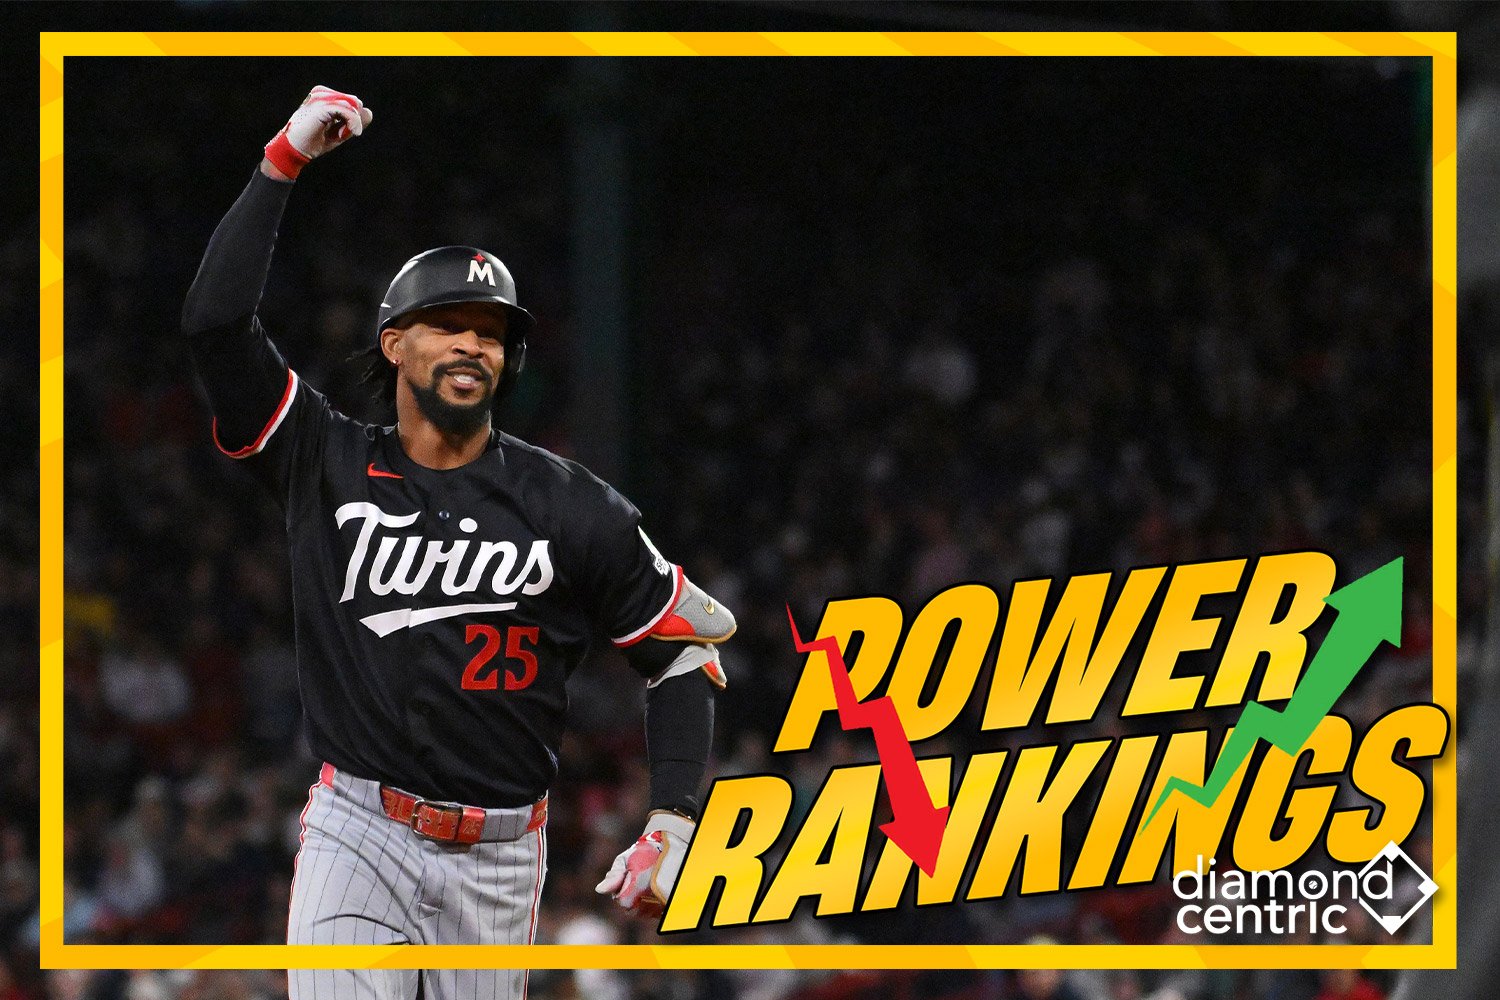 Memorial Day weekend has long been viewed as the unofficial start of summer, and around Major League Baseball, it often marks the point where the standings begin to feel more meaningful. With May coming to a close and June right around the corner, teams are moving beyond the randomness of the season’s opening weeks. Contenders are starting to create breathing room, while others are already searching for answers before the calendar fully flips to summer. That also makes this stretch of the season difficult to evaluate at face value. A club can surge up the standings with one hot road trip while another suddenly looks vulnerable after a rough week against quality competition. Records still matter, but they do not always reflect how sustainable a team’s performance actually is beneath the surface. That is why third-order wins offer a valuable lens for these rankings. Based on Clay Davenport’s adjusted standings, the metric looks beyond wins and losses by incorporating factors like run differential, strength of schedule, and ballpark effects. The goal is to measure how teams should be performing in a more neutral environment, rather than simply rewarding recent results. The result is a set of power rankings that focus more on long-term indicators than on short-term swings. Some teams continue to back up their strong starts with dominant underlying numbers, while others are surviving on timely hitting, bullpen magic, or favorable stretches of the schedule. The arrows below track how each club has moved since last week as baseball’s hierarchy becomes clearer heading into June. 1. Dodgers — 36.0–16.0 (.692) Biggest Weekly Storyline: Shohei Ohtani lowered his sub-one ERA even further after tossing five scoreless innings and picking up four strikeouts against the Padres on Wednesday night. He also hit a leadoff homer. He’s incredible. 2. Braves — 34.1–18.9 (.643) Biggest Weekly Storyline: Drake Baldwin was placed on the injured list on Tuesday due to an oblique strain. Through 48 games, he is hitting .303/.389/.543 (.932) with 13 home runs. 3. Yankees — 33.1–18.9 (.637) Biggest Weekly Storyline: Gerrit Cole made his season debut Friday vs. the Rays, and finished with six scoreless frames. He pitched in the majors for the first time since the 2024 World Series. 4. Brewers — 30.8–18.2 (.629) ⬆️ Biggest Weekly Storyline: Jacob Misiorowski is the only pitcher within the modern era of baseball to go four starts without allowing a run or extra base hit while also striking out at least 30 batters. 5. Rays — 28.5–20.5 (.582) ⬆️ Biggest Weekly Storyline: The Rays complete their MLB-best sixth sweep of the season on Thursday. 6. Cubs — 29.7–22.3 (.571) ⬇️ Biggest Weekly Storyline: Pete Crow-Armstrong had costly defensive errors on back-to-back days as part of a five-game losing streak that pushed the Cubs out of first in the NL Central. 7. Rangers — 27.9–23.1 (.547) ⬆️ Biggest Weekly Storyline: The Rangers already have Corey Seager and Wyatt Langford on the IL, and Brandon Nimmo left a game this week with right hamstring tightness. That’s a lot of star power out of Texas’ lineup. 8. Pirates — 28.3–23.6 (.545) ⬇️ Biggest Weekly Storyline: The Pirates' bullpen is costing them games as the club has the most extra-inning losses in MLB. 9. Marlins — 28.0–25.0 (.528) Biggest Weekly Storyline: Top pitching prospect Robby Snelling will miss the rest of the 2026 season after the team announced that he will undergo Tommy John surgery on Friday. 10. Blue Jays — 26.9–25.1 (.517) ⬆️ Biggest Weekly Storyline: Trey Yesavage has the second-lowest ERA through a pitcher’s first eight regular-season starts as a member of the Blue Jays franchise. His 1.83 ERA only trails Jeff Musselman (1.48 ERA). 11. Diamondbacks — 25.9–25.1 (.508) ⬆️ Biggest Weekly Storyline: Corbin Carroll hit a walk-off single on Thursday for the club’s fifth consecutive win. 12. Guardians — 27.4–26.6 (.507) ⬆️ Biggest Weekly Storyline: Cleveland finished off a four-game sweep of the Tigers to further push themselves ahead in the AL Central. 13. Cardinals — 25.3–25.7 (.496) ⬇️ Biggest Weekly Storyline: Dustin May was supposed to provide a veteran presence for the Cardinals' rotation, but he has struggled. On Thursday, he fell apart in the sixth inning and surrendered six hits, a homer, and four earned runs while striking out seven. 14. Twins — 25.6–26.5 (.491) ⬆️ Biggest Weekly Storyline: Minnesota demoted Royce Lewis earlier this week. In 31 games this year, he slashed .163/.261/.279 (540) with only six extra-base hits. However, the team kept rolling with a sweep in Boston. 15. Mariners — 26.0–27.0 (.491) ⬇️ Biggest Weekly Storyline: The Mariners called up top prospect Colt Emerson two months after signing him to a record $95 million contract. 16. Nationals — 26.0–27.0 (.491) ⬇️ Biggest Weekly Storyline: James Wood’s inside-the-park grand slam helped the Nationals defeat the Mets on Tuesday. 17. Tigers — 25.1–26.9 (.483) ⬇️ Biggest Weekly Storyline: The Tigers have the AL’s fifth-worst playoff odds according to FanGraphs at just over 20%. Luckily, two of the teams below them play in the AL Central (White Sox, Royals). 18. Red Sox — 24.7–26.4 (.483) Biggest Weekly Storyline: Jarren Duran became the 11th player in Red Sox history to reach 35 career triples and 100 stolen bases, and the first since Carl Yastrzemski. 19. Padres — 23.7–27.3 (.465) ⬆️ Biggest Weekly Storyline: Manny Machado has a -0.2 bWAR in 47 games due to a .178 batting average and a .603 OPS. His 70 OPS+ is the worst of his career by nearly 30 points. 20. Royals — 23.9–28.1 (.460) ⬇️ Biggest Weekly Storyline: The Royals are giving away runs on the bases. They have been caught stealing 15 times, picked off seven times, and run into outs on the bases 19 times this season. 21. White Sox — 23.3–27.7 (.457) ⬇️ Biggest Weekly Storyline: Grant Taylor earned his first save earlier this week. Leading into that game, he had allowed 0 earned runs and struck out 22 over his last 14 innings. 22. Phillies — 23.7–28.4 (.455) Biggest Weekly Storyline: Kyle Schwarber is on pace for 64 home runs and seems like a lock to smash 45 or more in four of his last five seasons. 23. Athletics — 23.3–28.7 (.448) ⬆️ Biggest Weekly Storyline: Luis Severino had a tremendous start this week. He worked seven innings by allowing two earned runs on three hits, with no walks and 10 strikeouts. 24. Angels — 23.4–29.6 (.442) ⬇️ Biggest Weekly Storyline: Stories swirled this week about the deals the Angels turned down for Shohei Ohtani during his final season of team control. Monster deals with the Padres or Rays could have helped the Angels rebuild and look foolish in hindsight. 25. Giants — 22.9–29.1 (.440) ⬆️ Biggest Weekly Storyline: The Giants were swept by the Diamondbacks and fell to 10 games under .500. 26. Mets — 22.8–29.2 (.438) ⬇️ Biggest Weekly Storyline: Huascar Brazoban has a 1.78 ERA in 25.1 innings, and his 2.57 xERA is the best on the team. 27. Orioles — 21.5–29.5 (.422) ⬆️ Biggest Weekly Storyline: Jackson Holliday was activated from IL after he underwent surgery for a fractured hamate in his right hand during spring training. 28. Astros — 21.1–32.0 (.397) Biggest Weekly Storyline: Lance McCullers Jr. was scratched from his scheduled start on Tuesday and placed on the injured list with right shoulder inflammation. He is now the fourth member of Houston's opening rotation to land on the IL this season. 29. Reds — 20.3–31.8 (.390) ⬇️ Biggest Weekly Storyline: Chase Burns lowered his ERA to 1.83 after pitching six innings and limiting the Phillies to one earned run. He struck out nine and didn’t walk any. 30. Rockies — 19.2–33.9 (.362) Biggest Weekly Storyline: The Rockies placed closer Victor Vodnik to the injured list with a right elbow injury. The team described the injury as inflammation in the right ulnar nerve. What storylines stood out this week? Do you agree with the rankings above? Leave a comment and start the discussion.
- 2 comments
-
- 1
-

-
- shohei ohtani
- manny machado
- (and 8 more)
-
Image courtesy of © Matt Krohn-Imagn Images With the 2026 season now more than 40 games old, Major League Baseball has officially moved beyond the small sample stage. The first quarter of the schedule is complete, and the standings are beginning to show real separation across both leagues. Some division races are already taking shape while other clubs are fighting to stay afloat before summer arrives. That also makes this point in the season one of the trickiest times to evaluate teams accurately. A strong week can dramatically change public perception while a brief slump suddenly raises questions about a contender’s legitimacy. Wins and losses still carry weight, but they often fail to capture how well a team is actually playing beneath the surface. That is where third order wins provide a more complete picture. Derived from Clay Davenport’s adjusted standings, the metric accounts for factors like run differential, quality of competition, and ballpark environment to better estimate how teams should be performing in a neutral context. Rather than reacting solely to recent results, it focuses on the underlying traits that tend to translate over a full season. The result is a ranking system designed to be more predictive than reactive. Some teams are proving their early success is sustainable while others continue to lean heavily on sequencing, bullpen fortune, or favorable schedules. The arrows below reflect how each club’s standing has shifted from last week as the league settles into its true hierarchy. 1. Dodgers — 31.0–14.9 (.675) Biggest Weekly Storyline: Blake Snell was scratched from before his second start of the season and put back on the IL with loose bodies in his left elbow. In 2019, he missed a couple months with a similar injury. 2. Braves — 30.3–15.7 (.659) ⬆️ Biggest Weekly Storyline: Bryce Elder is having his best season in the big leagues so far. In 54 2/3 innings, he has a league-leading 1.81 ERA with a 1.01 WHIP and a 219 ERA+. 3. Yankees — 29.8–16.2 (.648) ⬇️ Biggest Weekly Storyline: Gerrit Cole is expected to make one more rehab start at Triple-A, putting him in line to rejoin the Yankees by the end of May. That’s great news for a club that put Max Fried on the IL with a bone bruise earlier this week. 4. Cubs — 28.1–17.8 (.612) Biggest Weekly Storyline: The Cubs have drawn six walks or more in 40% of their games this season. They lead MLB with 210 walks with the Yankees being the only other team with more than 200 free passes. 5. Brewers — 25.8–17.2 (.600) ⬆️ Biggest Weekly Storyline: Aaron Ashby has eight wins this year, all in relief. No other pitcher has more than six wins. It’s the first time in the modern era that a pitcher had two more relief wins than any other MLB pitcher had total wins at the end of any given day. 6. Rays — 25.6–18.4 (.582) ⬆️ Biggest Weekly Storyline: The Rays reached a preliminary agreement with the city of Tampa and county officials on a new $2.3 billion ballpark. The new stadium has a targeted opening of Opening Day 2029. 7. Pirates — 25.8–20.2 (.561) ⬇️ Biggest Weekly Storyline: Paul Skenes threw eight innings of two-hit ball in one of the best performances of his career. He struck out seven including striking out the side in his final inning. 8. Rangers — 23.6–21.4 (.524) ⬆️ Biggest Weekly Storyline: Corey Seager was given a rest day on Friday in the middle of a career-worst 0-for-27 skid. He is batting under .180 on the season, over 100 points lower than his career average. 9. Marlins — 24.0–22.0 (.522) ⬇️ Biggest Weekly Storyline: Robby Snelling, Miami’s top pitching prospect, was placed on the IL with a sprained UCL. That type of injury is never good news for pitchers. 10. Tigers — 23.3–22.7 (.507) ⬆️ Biggest Weekly Storyline: Casey Mize rejoined the Tigers rotation on Saturday after missing two weeks with a right adductor strain. The team opted for him to skip a minor league rehab assignment. 11. Mariners — 23.7–23.3 (.504) ⬆️ Biggest Weekly Storyline: Cal Raleigh, the runner-up for AL MVP, was placed on the IL with an oblique injury. In 41 games this season, his .161 batting average is the lowest in the majors among 170 qualified batters. 12. Cardinals — 22.6–22.4 (.502) ⬇️ Biggest Weekly Storyline: The Cardinals have been one of MLB’s surprising teams this season and Jordan Walker has been the team’s sparkplug. On Thursday, he homered and drove in the go-ahead run in the ninth inning. 13. Guardians — 23.2–23.8 (.494) ⬇️ Biggest Weekly Storyline: Cleveland celebrated the 10-year anniversary of their heartbreaking loss in the 2016 World Series. The reunion weekend allowed players, coaches, and fans to reflect on their best season in recent memory. 14. Diamondbacks — 21.7–22.3 (.493) ⬆️ Biggest Weekly Storyline: Merrill Kelly threw his first career complete game against the Rockies on Friday. He scattered four hits and had three strikeouts without a walk. 15. Nationals — 22.2–23.8 (.483) ⬆️ Biggest Weekly Storyline: Daylen Lile went 10-for-20 in one stretch over the last week. This includes four homers and a game winning bomb. 16. Royals — 21.9–24.1 (.476) ⬇️ Biggest Weekly Storyline: Bobby Witt Jr. became the first MLB player to reach 3.0 WAR on Friday. He has a batting run value of nine and a league-leading fielding run value of eight. 17. Blue Jays — 21.3–23.7 (.473) ⬇️ Biggest Weekly Storyline: Jose Berrios underwent surgery on Wednesday to repair a stress fracture in his right elbow. There is some concern about his ligament in his elbow, which complicates any return timeline. 18. Red Sox — 21.2–23.8 (.471) ⬆️ Biggest Weekly Storyline: Trevor Story was placed on the IL with a sports hernia. His six errors lead all AL shortstops, while he's batting .206 with a .547 OPS. 19. White Sox — 21.2–23.8 (.471) ⬆️ Biggest Weekly Storyline: On Saturday, Munetaka Murakami reached 17 home runs through his first 45 MLB games. Only two players in MLB history have ever hit more home runs through their first 45 career games (Gary Sanchez and Rhys Hoskins). 20. Twins — 21.6–24.4 (.470) ⬆️ Biggest Weekly Storyline: Minnesota demoted Matt Wallner after a disastrous start to the year, slashing .167/.259/.292 (58 wRC+) with a 39.3% strikeout rate and a league-worst -8 Defensive Runs Saved. 21. Angels — 21.4–24.7 (.464) ⬇️ Biggest Weekly Storyline: Patrick O’Neal departed the Angels broadcast team after parts of 13 seasons. 22. Phillies — 21.0–25.0 (.457) ⬆️ Biggest Weekly Storyline: Cristopher Sánchez struck out a career-high 13 while picking up the second shutout of his big league career to help Philly climb back to .500. 23. Padres — 20.5–24.5 (.456) ⬇️ Biggest Weekly Storyline: Lucas Giolito made his much anticipated Padres debut on Sunday after waiting out the free agent market until the season was already underway. 24. Athletics — 19.9–25.1 (.442) ⬇️ Biggest Weekly Storyline: Henry Bolte, one of the A’s top prospects, reached base three times in his debut and made a tremendous diving grab that included a 28.5 ft/sec sprint speed. 25. Mets — 19.9–25.1 (.442) ⬇️ Biggest Weekly Storyline: Juan Soto joined an elite group this week with 250+ home runs and 95+ SB before turning 28. Other players on the list include: Alex Rodriguez, Ken Griffey Jr., Mickey Mantle, Mike Trout, Frank Robinson, and Andruw Jones. 26. Giants — 19.8–26.2 (.430) ⬆️ Biggest Weekly Storyline: Luis Arraez had a four-hit game and finished a triple shy of the cycle on Friday night versus the A’s. For Arraez, it was his 16th multi-hit game in the 45 games the Giants have played so far this season. 27. Reds — 18.6–27.4 (.404) ⬆️ Biggest Weekly Storyline: Chris Paddack was picked up off waivers by the Reds and had an impressive first start. In five innings, he scattered six hits and allowed two earned runs. 28. Astros — 18.9–28.2 (.401) ⬇️ Biggest Weekly Storyline: The Astros have been plagued by injuries this season and that continued this week. Jose Altuve left Saturday’s game after taking an awkward swing and pulling something on his left side. 29. Orioles — 18.3–27.7 (.398) Biggest Weekly Storyline: Samuel Basallo started the year on a cold streak (.140 BA in 16 G). Since that point, he has raised his OPS from .592 to .819. 30. Rockies — 17.7–28.3 (.385) ⬇️ Biggest Weekly Storyline: Hunter Goodman is building off his 2025 All-Star campaign. So far this season, he’s hit 11 home runs and posted a 119 OPS+. What storylines stood out this week? Do you agree with the rankings above? Leave a comment and start the discussion. View full article
-
MLB Power Rankings: Blue Jays & Padres Falling, Brewers Burst Into Top Five
Cody Christie posted an article in MLB
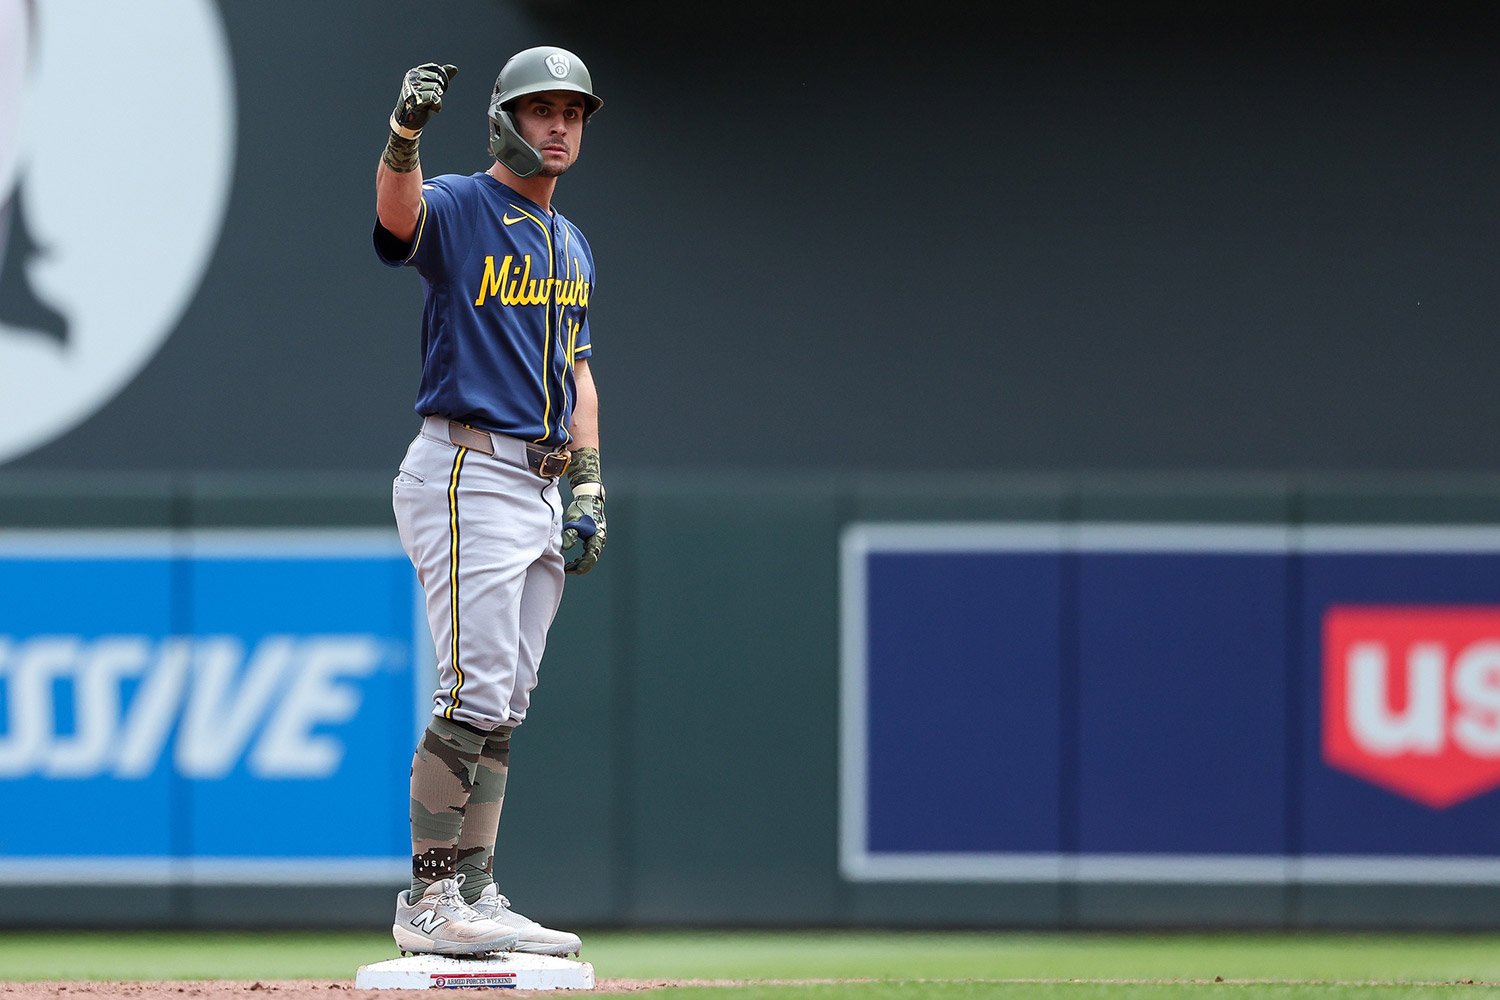 With the 2026 season now more than 40 games old, Major League Baseball has officially moved beyond the small sample stage. The first quarter of the schedule is complete, and the standings are beginning to show real separation across both leagues. Some division races are already taking shape while other clubs are fighting to stay afloat before summer arrives. That also makes this point in the season one of the trickiest times to evaluate teams accurately. A strong week can dramatically change public perception while a brief slump suddenly raises questions about a contender’s legitimacy. Wins and losses still carry weight, but they often fail to capture how well a team is actually playing beneath the surface. That is where third order wins provide a more complete picture. Derived from Clay Davenport’s adjusted standings, the metric accounts for factors like run differential, quality of competition, and ballpark environment to better estimate how teams should be performing in a neutral context. Rather than reacting solely to recent results, it focuses on the underlying traits that tend to translate over a full season. The result is a ranking system designed to be more predictive than reactive. Some teams are proving their early success is sustainable while others continue to lean heavily on sequencing, bullpen fortune, or favorable schedules. The arrows below reflect how each club’s standing has shifted from last week as the league settles into its true hierarchy. 1. Dodgers — 31.0–14.9 (.675) Biggest Weekly Storyline: Blake Snell was scratched from before his second start of the season and put back on the IL with loose bodies in his left elbow. In 2019, he missed a couple months with a similar injury. 2. Braves — 30.3–15.7 (.659) ⬆️ Biggest Weekly Storyline: Bryce Elder is having his best season in the big leagues so far. In 54 2/3 innings, he has a league-leading 1.81 ERA with a 1.01 WHIP and a 219 ERA+. 3. Yankees — 29.8–16.2 (.648) ⬇️ Biggest Weekly Storyline: Gerrit Cole is expected to make one more rehab start at Triple-A, putting him in line to rejoin the Yankees by the end of May. That’s great news for a club that put Max Fried on the IL with a bone bruise earlier this week. 4. Cubs — 28.1–17.8 (.612) Biggest Weekly Storyline: The Cubs have drawn six walks or more in 40% of their games this season. They lead MLB with 210 walks with the Yankees being the only other team with more than 200 free passes. 5. Brewers — 25.8–17.2 (.600) ⬆️ Biggest Weekly Storyline: Aaron Ashby has eight wins this year, all in relief. No other pitcher has more than six wins. It’s the first time in the modern era that a pitcher had two more relief wins than any other MLB pitcher had total wins at the end of any given day. 6. Rays — 25.6–18.4 (.582) ⬆️ Biggest Weekly Storyline: The Rays reached a preliminary agreement with the city of Tampa and county officials on a new $2.3 billion ballpark. The new stadium has a targeted opening of Opening Day 2029. 7. Pirates — 25.8–20.2 (.561) ⬇️ Biggest Weekly Storyline: Paul Skenes threw eight innings of two-hit ball in one of the best performances of his career. He struck out seven including striking out the side in his final inning. 8. Rangers — 23.6–21.4 (.524) ⬆️ Biggest Weekly Storyline: Corey Seager was given a rest day on Friday in the middle of a career-worst 0-for-27 skid. He is batting under .180 on the season, over 100 points lower than his career average. 9. Marlins — 24.0–22.0 (.522) ⬇️ Biggest Weekly Storyline: Robby Snelling, Miami’s top pitching prospect, was placed on the IL with a sprained UCL. That type of injury is never good news for pitchers. 10. Tigers — 23.3–22.7 (.507) ⬆️ Biggest Weekly Storyline: Casey Mize rejoined the Tigers rotation on Saturday after missing two weeks with a right adductor strain. The team opted for him to skip a minor league rehab assignment. 11. Mariners — 23.7–23.3 (.504) ⬆️ Biggest Weekly Storyline: Cal Raleigh, the runner-up for AL MVP, was placed on the IL with an oblique injury. In 41 games this season, his .161 batting average is the lowest in the majors among 170 qualified batters. 12. Cardinals — 22.6–22.4 (.502) ⬇️ Biggest Weekly Storyline: The Cardinals have been one of MLB’s surprising teams this season and Jordan Walker has been the team’s sparkplug. On Thursday, he homered and drove in the go-ahead run in the ninth inning. 13. Guardians — 23.2–23.8 (.494) ⬇️ Biggest Weekly Storyline: Cleveland celebrated the 10-year anniversary of their heartbreaking loss in the 2016 World Series. The reunion weekend allowed players, coaches, and fans to reflect on their best season in recent memory. 14. Diamondbacks — 21.7–22.3 (.493) ⬆️ Biggest Weekly Storyline: Merrill Kelly threw his first career complete game against the Rockies on Friday. He scattered four hits and had three strikeouts without a walk. 15. Nationals — 22.2–23.8 (.483) ⬆️ Biggest Weekly Storyline: Daylen Lile went 10-for-20 in one stretch over the last week. This includes four homers and a game winning bomb. 16. Royals — 21.9–24.1 (.476) ⬇️ Biggest Weekly Storyline: Bobby Witt Jr. became the first MLB player to reach 3.0 WAR on Friday. He has a batting run value of nine and a league-leading fielding run value of eight. 17. Blue Jays — 21.3–23.7 (.473) ⬇️ Biggest Weekly Storyline: Jose Berrios underwent surgery on Wednesday to repair a stress fracture in his right elbow. There is some concern about his ligament in his elbow, which complicates any return timeline. 18. Red Sox — 21.2–23.8 (.471) ⬆️ Biggest Weekly Storyline: Trevor Story was placed on the IL with a sports hernia. His six errors lead all AL shortstops, while he's batting .206 with a .547 OPS. 19. White Sox — 21.2–23.8 (.471) ⬆️ Biggest Weekly Storyline: On Saturday, Munetaka Murakami reached 17 home runs through his first 45 MLB games. Only two players in MLB history have ever hit more home runs through their first 45 career games (Gary Sanchez and Rhys Hoskins). 20. Twins — 21.6–24.4 (.470) ⬆️ Biggest Weekly Storyline: Minnesota demoted Matt Wallner after a disastrous start to the year, slashing .167/.259/.292 (58 wRC+) with a 39.3% strikeout rate and a league-worst -8 Defensive Runs Saved. 21. Angels — 21.4–24.7 (.464) ⬇️ Biggest Weekly Storyline: Patrick O’Neal departed the Angels broadcast team after parts of 13 seasons. 22. Phillies — 21.0–25.0 (.457) ⬆️ Biggest Weekly Storyline: Cristopher Sánchez struck out a career-high 13 while picking up the second shutout of his big league career to help Philly climb back to .500. 23. Padres — 20.5–24.5 (.456) ⬇️ Biggest Weekly Storyline: Lucas Giolito made his much anticipated Padres debut on Sunday after waiting out the free agent market until the season was already underway. 24. Athletics — 19.9–25.1 (.442) ⬇️ Biggest Weekly Storyline: Henry Bolte, one of the A’s top prospects, reached base three times in his debut and made a tremendous diving grab that included a 28.5 ft/sec sprint speed. 25. Mets — 19.9–25.1 (.442) ⬇️ Biggest Weekly Storyline: Juan Soto joined an elite group this week with 250+ home runs and 95+ SB before turning 28. Other players on the list include: Alex Rodriguez, Ken Griffey Jr., Mickey Mantle, Mike Trout, Frank Robinson, and Andruw Jones. 26. Giants — 19.8–26.2 (.430) ⬆️ Biggest Weekly Storyline: Luis Arraez had a four-hit game and finished a triple shy of the cycle on Friday night versus the A’s. For Arraez, it was his 16th multi-hit game in the 45 games the Giants have played so far this season. 27. Reds — 18.6–27.4 (.404) ⬆️ Biggest Weekly Storyline: Chris Paddack was picked up off waivers by the Reds and had an impressive first start. In five innings, he scattered six hits and allowed two earned runs. 28. Astros — 18.9–28.2 (.401) ⬇️ Biggest Weekly Storyline: The Astros have been plagued by injuries this season and that continued this week. Jose Altuve left Saturday’s game after taking an awkward swing and pulling something on his left side. 29. Orioles — 18.3–27.7 (.398) Biggest Weekly Storyline: Samuel Basallo started the year on a cold streak (.140 BA in 16 G). Since that point, he has raised his OPS from .592 to .819. 30. Rockies — 17.7–28.3 (.385) ⬇️ Biggest Weekly Storyline: Hunter Goodman is building off his 2025 All-Star campaign. So far this season, he’s hit 11 home runs and posted a 119 OPS+. What storylines stood out this week? Do you agree with the rankings above? Leave a comment and start the discussion.
 -
Image courtesy of © Junfu Han / USA TODAY NETWORK via Imagn Images Major League Baseball’s next labor fight is officially underway. According to multiple reports, representatives from MLB and the MLB Players Association met Tuesday in New York to begin negotiations on the next Collective Bargaining Agreement. While serious proposal exchanges are still weeks away, the opening meetings traditionally serve as an opportunity for both sides to present their view of the current state of the game and establish the groundwork for the months ahead. The current CBA expires at 11:59 p.m. ET on December 1. If a new agreement is not reached by then, another lockout appears likely. Owners locked out players during the 2021-2022 offseason in what became baseball’s first work stoppage since the devastating 1994-1995 strike. Although regular-season games were ultimately preserved, spring training was delayed, and the sport spent months overshadowed by labor tension. This time around, the stakes feel even larger. The league is approaching negotiations at a time when franchise values continue to rise, national television contracts are nearing expiration, and competitive balance remains one of the sport’s most debated topics. Meanwhile, the union enters talks with new leadership after longtime MLBPA executive director Tony Clark stepped down earlier this year following an internal investigation. Bruce Meyer, the union’s longtime lead negotiator, has stepped into the interim executive director role and is expected to guide negotiations moving forward. “We don't expect anything to change in terms of bargaining,” Meyer said earlier this year. “We've been preparing for bargaining for years. Players have been preparing. Players know what's coming.” As always, the biggest conversations will revolve around money, power, and the future structure of the sport. Here are the major issues expected to be at the center of negotiations. The Salary Cap Debate Is Back Again The issue expected to dominate negotiations is one baseball has fought over for generations: a salary cap. MLB owners are once again expected to push for a payroll system that limits spending. The league has argued for years that a cap could improve competitive balance by preventing large market clubs from dramatically outspending smaller organizations. Players see it very differently. The MLBPA has historically viewed a salary cap as a direct restriction on earning potential and has fiercely resisted it in every negotiation cycle. Baseball currently stands as the only major North American professional sports league without a formal salary cap structure, something the union considers a major victory. At its core, the fight is about revenue distribution. Baseball generates enormous amounts of money, and both sides are battling over how that money is divided. While owners often frame a salary cap as a competitive balance issue, the union believes such a system would primarily suppress salaries while further increasing franchise profitability. Even if the union were willing to discuss a cap, the complexity of implementing one creates another layer of conflict. Questions immediately emerge about what qualifies as baseball-related revenue, how large the cap would be, whether there would be a mandatory payroll floor, and what percentage of revenue players would ultimately receive. Simply agreeing to discuss a cap would only mark the start of the real negotiation. Because of that, many around the sport already view this as the defining issue that could determine whether baseball experiences another work stoppage before the 2027 season. Revenue Sharing Could See Significant Changes Another major point of contention will be MLB’s revenue-sharing system. Revenue sharing is designed to help smaller-market organizations remain competitive by redistributing funds from higher-revenue clubs. However, critics have long argued that some teams receive revenue-sharing funds without reinvesting those dollars into payroll or player development. If owners continue pushing for greater payroll restrictions, the union will likely counter by demanding stronger incentives for clubs to spend competitively. This could lead to discussions about payroll minimums or changes to how revenue-sharing funds are distributed and monitored. Even without a salary cap agreement, many around the sport expect the current system to undergo meaningful revisions during this negotiation cycle. For smaller market clubs, these conversations matter tremendously. Changes to revenue sharing could affect payroll flexibility, free-agent strategies, and long-term roster construction across the league. Postseason Expansion Remains on the Table Baseball’s postseason field expanded to 12 teams during the last CBA negotiations, but further expansion is already being discussed. Owners have strong financial incentives to add more playoff games because postseason television inventory generates significant revenue. More playoff teams also keep their fan bases engaged throughout the season. Players, however, may seek concessions in exchange for agreeing to another expansion. Concerns about preserving the importance of the regular season will likely remain part of the conversation. Some fans already believe the current format waters down the grind of a 162-game season. Others enjoy the added drama and broader playoff races that expanded formats create. Whether the postseason grows again may ultimately depend on what the union can gain elsewhere in negotiations. The International Draft Debate Continues The idea of an international draft has lingered over baseball for years and is expected to resurface again during these talks. Currently, international amateur players primarily sign through a bonus pool system that has often drawn criticism regarding corruption, early verbal agreements, and uneven scouting practices. Owners have frequently supported an international draft to create a more structured and transparent signing process. The union, however, has historically been cautious about how such a system could impact player freedom and earning potential for young international prospects. This issue nearly became part of the last CBA negotiations before the sides ultimately failed to reach an agreement. Given baseball’s growing international influence, particularly in countries like the Dominican Republic and Venezuela, the topic is unlikely to disappear anytime soon. Expansion and Realignment Could Shape Baseball’s Future Commissioner Rob Manfred has openly stated that he hopes to begin the expansion process before his contract expires in January 2029. That timeline makes these negotiations especially important. Expansion discussions naturally bring additional questions involving divisional realignment, scheduling, television rights, and revenue distribution. Potential expansion cities frequently connected to MLB include Nashville, Montreal, Portland, and Raleigh. Adding two new franchises would dramatically reshape the sport’s geographic footprint and could trigger significant realignment changes across both leagues. Expansion fees would also provide owners with another substantial financial windfall, further emphasizing how closely these negotiations are tied to the sport’s long-term economic future. A Long Road Ahead Although negotiations have officially begun, baseball is still in the early stages of what could become a lengthy and contentious process. The two sides have months before the December 1 expiration deadline, and both MLB and the MLBPA understand the damage another prolonged work stoppage could cause. National television deals expire in 2028, making uninterrupted seasons critically important for the league’s future business interests. Still, history shows that labor peace in baseball is never simple. The salary cap debate alone has the potential to create enormous friction, and the additional discussions surrounding revenue sharing, postseason expansion, international amateur talent, and league expansion only add more complexity to the process. For now, the meetings in New York simply mark the beginning of another massive negotiation that could shape the direction of Major League Baseball for the next decade. What will be the biggest issue in the next CBA? Leave a comment and start the discussion. View full article
-
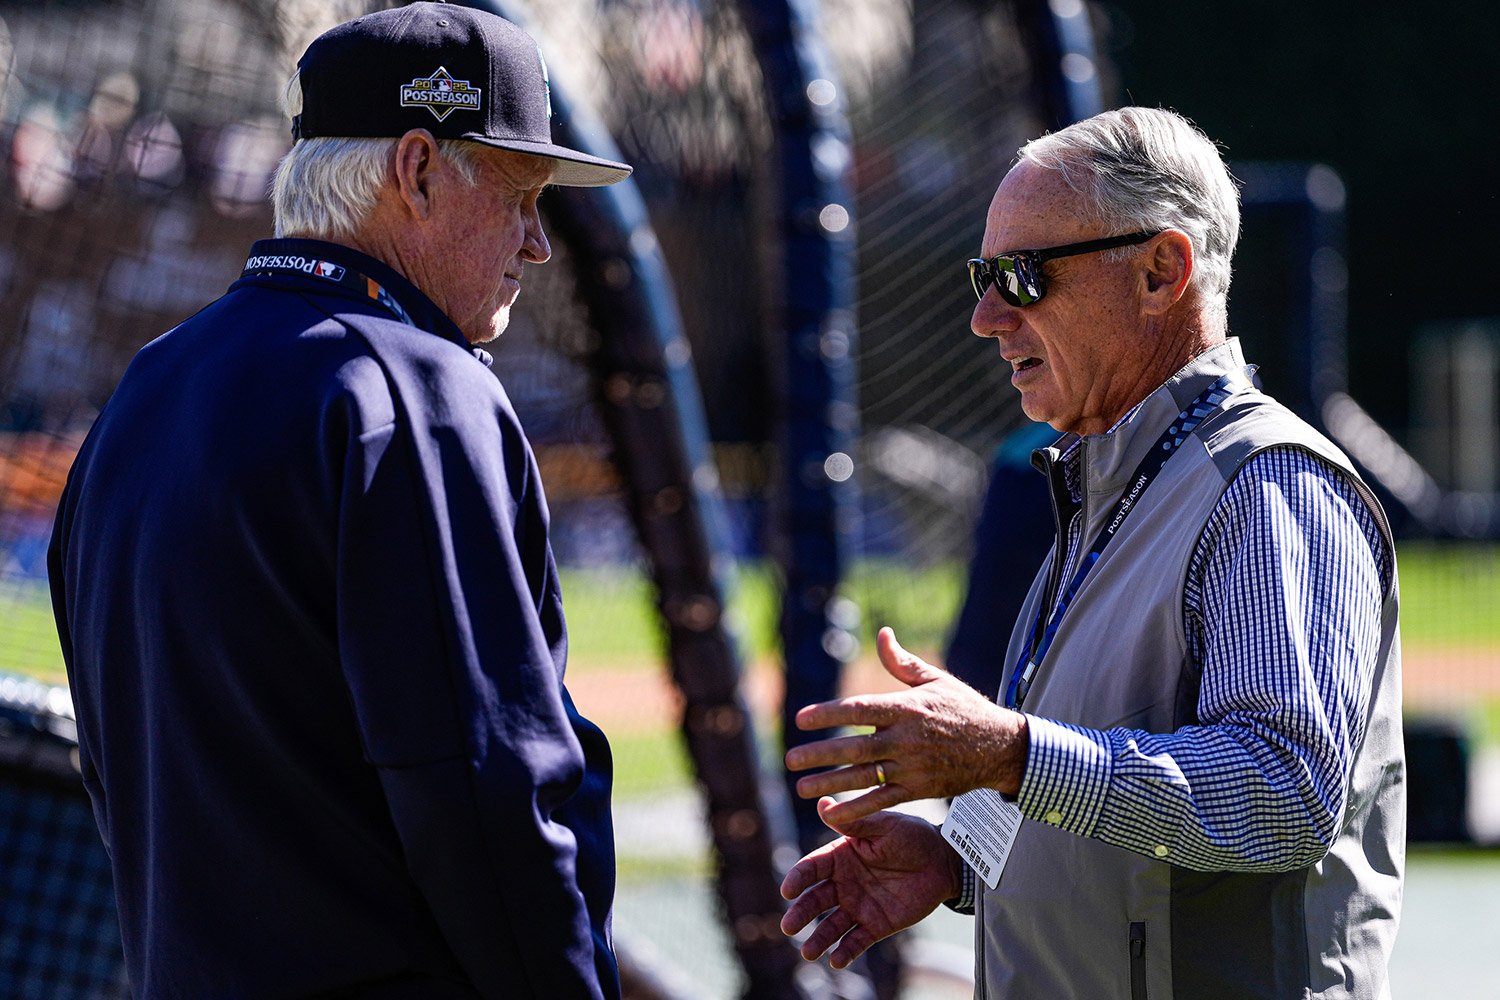 Major League Baseball’s next labor fight is officially underway. According to multiple reports, representatives from MLB and the MLB Players Association met Tuesday in New York to begin negotiations on the next Collective Bargaining Agreement. While serious proposal exchanges are still weeks away, the opening meetings traditionally serve as an opportunity for both sides to present their view of the current state of the game and establish the groundwork for the months ahead. The current CBA expires at 11:59 p.m. ET on December 1. If a new agreement is not reached by then, another lockout appears likely. Owners locked out players during the 2021-2022 offseason in what became baseball’s first work stoppage since the devastating 1994-1995 strike. Although regular-season games were ultimately preserved, spring training was delayed, and the sport spent months overshadowed by labor tension. This time around, the stakes feel even larger. The league is approaching negotiations at a time when franchise values continue to rise, national television contracts are nearing expiration, and competitive balance remains one of the sport’s most debated topics. Meanwhile, the union enters talks with new leadership after longtime MLBPA executive director Tony Clark stepped down earlier this year following an internal investigation. Bruce Meyer, the union’s longtime lead negotiator, has stepped into the interim executive director role and is expected to guide negotiations moving forward. “We don't expect anything to change in terms of bargaining,” Meyer said earlier this year. “We've been preparing for bargaining for years. Players have been preparing. Players know what's coming.” As always, the biggest conversations will revolve around money, power, and the future structure of the sport. Here are the major issues expected to be at the center of negotiations. The Salary Cap Debate Is Back Again The issue expected to dominate negotiations is one baseball has fought over for generations: a salary cap. MLB owners are once again expected to push for a payroll system that limits spending. The league has argued for years that a cap could improve competitive balance by preventing large market clubs from dramatically outspending smaller organizations. Players see it very differently. The MLBPA has historically viewed a salary cap as a direct restriction on earning potential and has fiercely resisted it in every negotiation cycle. Baseball currently stands as the only major North American professional sports league without a formal salary cap structure, something the union considers a major victory. At its core, the fight is about revenue distribution. Baseball generates enormous amounts of money, and both sides are battling over how that money is divided. While owners often frame a salary cap as a competitive balance issue, the union believes such a system would primarily suppress salaries while further increasing franchise profitability. Even if the union were willing to discuss a cap, the complexity of implementing one creates another layer of conflict. Questions immediately emerge about what qualifies as baseball-related revenue, how large the cap would be, whether there would be a mandatory payroll floor, and what percentage of revenue players would ultimately receive. Simply agreeing to discuss a cap would only mark the start of the real negotiation. Because of that, many around the sport already view this as the defining issue that could determine whether baseball experiences another work stoppage before the 2027 season. Revenue Sharing Could See Significant Changes Another major point of contention will be MLB’s revenue-sharing system. Revenue sharing is designed to help smaller-market organizations remain competitive by redistributing funds from higher-revenue clubs. However, critics have long argued that some teams receive revenue-sharing funds without reinvesting those dollars into payroll or player development. If owners continue pushing for greater payroll restrictions, the union will likely counter by demanding stronger incentives for clubs to spend competitively. This could lead to discussions about payroll minimums or changes to how revenue-sharing funds are distributed and monitored. Even without a salary cap agreement, many around the sport expect the current system to undergo meaningful revisions during this negotiation cycle. For smaller market clubs, these conversations matter tremendously. Changes to revenue sharing could affect payroll flexibility, free-agent strategies, and long-term roster construction across the league. Postseason Expansion Remains on the Table Baseball’s postseason field expanded to 12 teams during the last CBA negotiations, but further expansion is already being discussed. Owners have strong financial incentives to add more playoff games because postseason television inventory generates significant revenue. More playoff teams also keep their fan bases engaged throughout the season. Players, however, may seek concessions in exchange for agreeing to another expansion. Concerns about preserving the importance of the regular season will likely remain part of the conversation. Some fans already believe the current format waters down the grind of a 162-game season. Others enjoy the added drama and broader playoff races that expanded formats create. Whether the postseason grows again may ultimately depend on what the union can gain elsewhere in negotiations. The International Draft Debate Continues The idea of an international draft has lingered over baseball for years and is expected to resurface again during these talks. Currently, international amateur players primarily sign through a bonus pool system that has often drawn criticism regarding corruption, early verbal agreements, and uneven scouting practices. Owners have frequently supported an international draft to create a more structured and transparent signing process. The union, however, has historically been cautious about how such a system could impact player freedom and earning potential for young international prospects. This issue nearly became part of the last CBA negotiations before the sides ultimately failed to reach an agreement. Given baseball’s growing international influence, particularly in countries like the Dominican Republic and Venezuela, the topic is unlikely to disappear anytime soon. Expansion and Realignment Could Shape Baseball’s Future Commissioner Rob Manfred has openly stated that he hopes to begin the expansion process before his contract expires in January 2029. That timeline makes these negotiations especially important. Expansion discussions naturally bring additional questions involving divisional realignment, scheduling, television rights, and revenue distribution. Potential expansion cities frequently connected to MLB include Nashville, Montreal, Portland, and Raleigh. Adding two new franchises would dramatically reshape the sport’s geographic footprint and could trigger significant realignment changes across both leagues. Expansion fees would also provide owners with another substantial financial windfall, further emphasizing how closely these negotiations are tied to the sport’s long-term economic future. A Long Road Ahead Although negotiations have officially begun, baseball is still in the early stages of what could become a lengthy and contentious process. The two sides have months before the December 1 expiration deadline, and both MLB and the MLBPA understand the damage another prolonged work stoppage could cause. National television deals expire in 2028, making uninterrupted seasons critically important for the league’s future business interests. Still, history shows that labor peace in baseball is never simple. The salary cap debate alone has the potential to create enormous friction, and the additional discussions surrounding revenue sharing, postseason expansion, international amateur talent, and league expansion only add more complexity to the process. For now, the meetings in New York simply mark the beginning of another massive negotiation that could shape the direction of Major League Baseball for the next decade. What will be the biggest issue in the next CBA? Leave a comment and start the discussion.
 -
Image courtesy of © Mark Hoffman/Milwaukee Journal Sentinel / USA TODAY NETWORK via Imagn Images Power rankings have never been harder to trust than they are during the middle months of a baseball season. A hot week can launch a mediocre club into the top ten while a rough road trip suddenly turns a contender into a “team in trouble.” Wins and losses still matter, but they rarely tell the full story of how a team is actually performing beneath the surface. That is where third order wins help separate noise from substance. Based on Clay Davenport’s adjusted standings, this metric strips away some of the randomness that can cloud a team’s record by accounting for factors like run differential, strength of schedule, and ballpark environment. Instead of focusing strictly on what has happened, it provides a clearer picture of how teams should be performing in a more neutral setting. The result is a ranking system built to be more predictive than reactive. Some clubs continue to validate their place among baseball’s elite, while others are surviving on timely hits, bullpen luck, or favorable scheduling. The arrows below reflect how each team’s standing changed from last week as the season continues to take shape. 1. Dodgers — 27.0–12.0 (.692) Biggest Weekly Storyline: Blake Snell made his season debut over the weekend, while Tyler Glasnow headed to the 15-day IL with low back spasms. One of the benefits on LA’s monster payroll is there is plenty of pitching depth. 2. Yankees — 26.7–13.3 (.668) Biggest Weekly Storyline: New York called up top outfield prospect Spencer Jones after outfielder Jasson Dominguez headed to the IL. Jones posted a .258/.366/.592 slash line in 33 games with 11 homers and a 32.4 K%. 3. Braves — 25.8–14.2 (.645) Biggest Weekly Storyline: Legendary manager Bobby Cox passed away over the weekend. He won over 2,500 games as manager of the Braves and Blue Jays and won the 1995 World Series. 4. Cubs — 25.3–14.6 (.634) Biggest Weekly Storyline: The Cubs have two 10-game winning streaks in one season for the first time since 1935. 5. Pirates — 23.4–16.6 (.585) ⬆️ Biggest Weekly Storyline: Paul Skenes threw eight innings of two-hit ball in one of the best performances of his career. He struck out seven, including striking out the side in his final inning. 6. Brewers — 21.6–15.4 (.584) ⬆️ Biggest Weekly Storyline: On Friday, Jacob Misiorowski’s first inning against the Yankees set velocity records for a starting pitcher. He threw 10 pitches all above 102 mph and had a 103.6 mph fastball that set the record for fastest pitch thrown by a starter in the pitch-tracking era. 7. Rays — 21.7–16.3 (.571) Biggest Weekly Storyline: Tampa saw its seven-game winning streak end earlier this week. During that stretch, they set a franchise record of 12 consecutive games giving up three or fewer runs. 8. Marlins — 21.7–18.3 (.543) ⬇️ Biggest Weekly Storyline: Joe Mack, a consensus top-100 prospect, was called up this week. Last season, he had an .813 OPS and a 120 wRC+ in 112 games. 9. Rangers — 21.0–18.0 (.538) ⬆️ Biggest Weekly Storyline: Nathan Eovaldi tossed eight innings and held a red-hot Yankees roster to one run on three hits. He struck out eight and didn’t issue a walk. 10. Cardinals — 20.0–19.0 (.513) ⬆️ Biggest Weekly Storyline: JJ Wetherholt turned a routine single into a “Little League Grand Slam” after the ball slipped under the glove of Fernando Tatis Jr. 11. Tigers — 20.2–19.8 (.505) ⬇️ Biggest Weekly Storyline: Tarik Skubal underwent left elbow surgery to remove bone chips and is expected to miss up to two months. 12. Guardians — 20.4–20.6 (.498) ⬇️ Biggest Weekly Storyline: Cleveland traded for the two-time Gold Glove catcher Patrick Bailey from the Giants for the No. 29 pick in this year’s MLB Draft and left-handed pitching prospect Matt Wilkinson. 13. Blue Jays — 19.3–19.7 (.495) ⬆️ Biggest Weekly Storyline: Dylan Cease is leading MLB in strikeouts (66 K) after a 10-strikeout performance on Friday. In seven shutout innings, he scattered five hits and didn’t allow a walk. 14. Royals — 19.7–20.3 (.493) ⬆️ Biggest Weekly Storyline: Carlos Estevez, the Royals’ closer, will be shut down for the next three weeks with a right rotator cuff strain. Starting pitcher Cole Ragans was placed on the IL with a left elbow impingement. 15. Mariners — 19.7–20.3 (.493) ⬇️ Biggest Weekly Storyline: Luke Raley hit a grand slam and a three-run homer in the same game to help Seattle score a season-high 12 runs. 16. Nationals — 19.3–20.7 (.482) ⬆️ Biggest Weekly Storyline: Gus Varland has quietly earned the closer job in Washington after bouncing around a lot on the waiver wire. His 2.46 FIP and 4.8 BB% could be signs of better future performance. 17. Angels — 19.1–20.9 (.478) ⬇️ Biggest Weekly Storyline: Walbert Urena went six innings, allowing one earned run on two hits with three walks and five strikeouts. The performance brought Ureña’s ERA down to 3.22. 18. Diamondbacks — 18.0–20.0 (.474) ⬆️ Biggest Weekly Storyline: Eduardo Rodriguez gave Arizona their best start of the year. In seven shutout innings, he limited Pittsburgh to two hits while striking out seven. 19. Athletics — 18.0–21.0 (.462) ⬇️ Biggest Weekly Storyline: Nick Kurtz extended his on-base streak to an MLB-best 32-games. He is also tied for the MLB-lead in walks (36) with Mike Trout. 20. Padres — 17.9–21.1 (.459) ⬇️ Biggest Weekly Storyline: Jake Cronenworth has been dealing with bouts of fogginess and difficulty focusing during at-bats as he deals with long-term concussion symptoms. Earlier this year, he was hit in the jaw by a pitch. 21. White Sox — 17.7–21.3 (.454) ⬆️ Biggest Weekly Storyline: Munetaka Murakami has now homered in eight straight series openers, an MLB record that was held by Eddie Murray (1987). 22. Red Sox — 17.4–21.6 (.446) ⬆️ Biggest Weekly Storyline: Connelly Early and Payton Tolle may be saving Boston’s rotation and their season. Early has a 130 ERA+ and a 22.0 K%, while Early has a 205 ERA+ and a 34.3 K%. 23. Phillies — 17.6–22.5 (.439) ⬆️ Biggest Weekly Storyline: Alec Bohm has been one of baseball’s worst hitters this year with a 21 OPS+ and producing -0.8 rWAR. He’s become unplayable for a Phillies team trying to get back into contention. 24. Mets — 16.8–22.2 (.431) ⬇️ Biggest Weekly Storyline: Rumors are already swirling that the Mets have talked to several teams about trading Freddy Peralta. For a team that expected to contend, this is an early white flag. 25. Twins — 17.2–22.8 (.430) ⬇️ Biggest Weekly Storyline: Taj Bradley was placed on the IL with right pectoral muscle inflammation. He was off to a terrific start with a 2.87 ERA and a 1.19 WHIP in 47 innings. 26. Astros — 17.0–23.0 (.425) ⬇️ Biggest Weekly Storyline: Carlos Correa has a torn tendon in his left ankle and will miss 6-8 months. He sustained the injury during batting practice when he swung and felt a pop. 27. Rockies — 16.7–23.4 (.416) ⬇️ Biggest Weekly Storyline: In a tie game, Colorado loaded the bases against Craig Kimbrel with no outs in a tie game. Jake McCarthy cracked a grand slam to send the Mets to another loss. 28. Reds — 15.6–24.4 (.390) Biggest Weekly Storyline: Chase Burns helped the Red snap an 8-game losing streak. In six innings, he allowed one run on four hits with two strikeouts. He has the third-best ERA in the NL. 29. Orioles — 15.4–24.6 (.385) ⬆️ Biggest Weekly Storyline: Shane Baz hasn’t lived up to expectations since being traded to Baltimore. In 39 2/3 innings, he has a 4.99 ERA with a 1.54 WHIP. 30. Giants — 14.8–24.2 (.379) ⬇️ Biggest Weekly Storyline: Logan Webb had made 156 consecutive starts before going on the IL with right knee bursitis. That streak dated back to 2021. What storylines stood out this week? Do you agree with the rankings above? Leave a comment and start the discussion. View full article
-
MLB Power Rankings: Brewers Rising, Twins & Mets Disappearing
Cody Christie posted an article in MLB
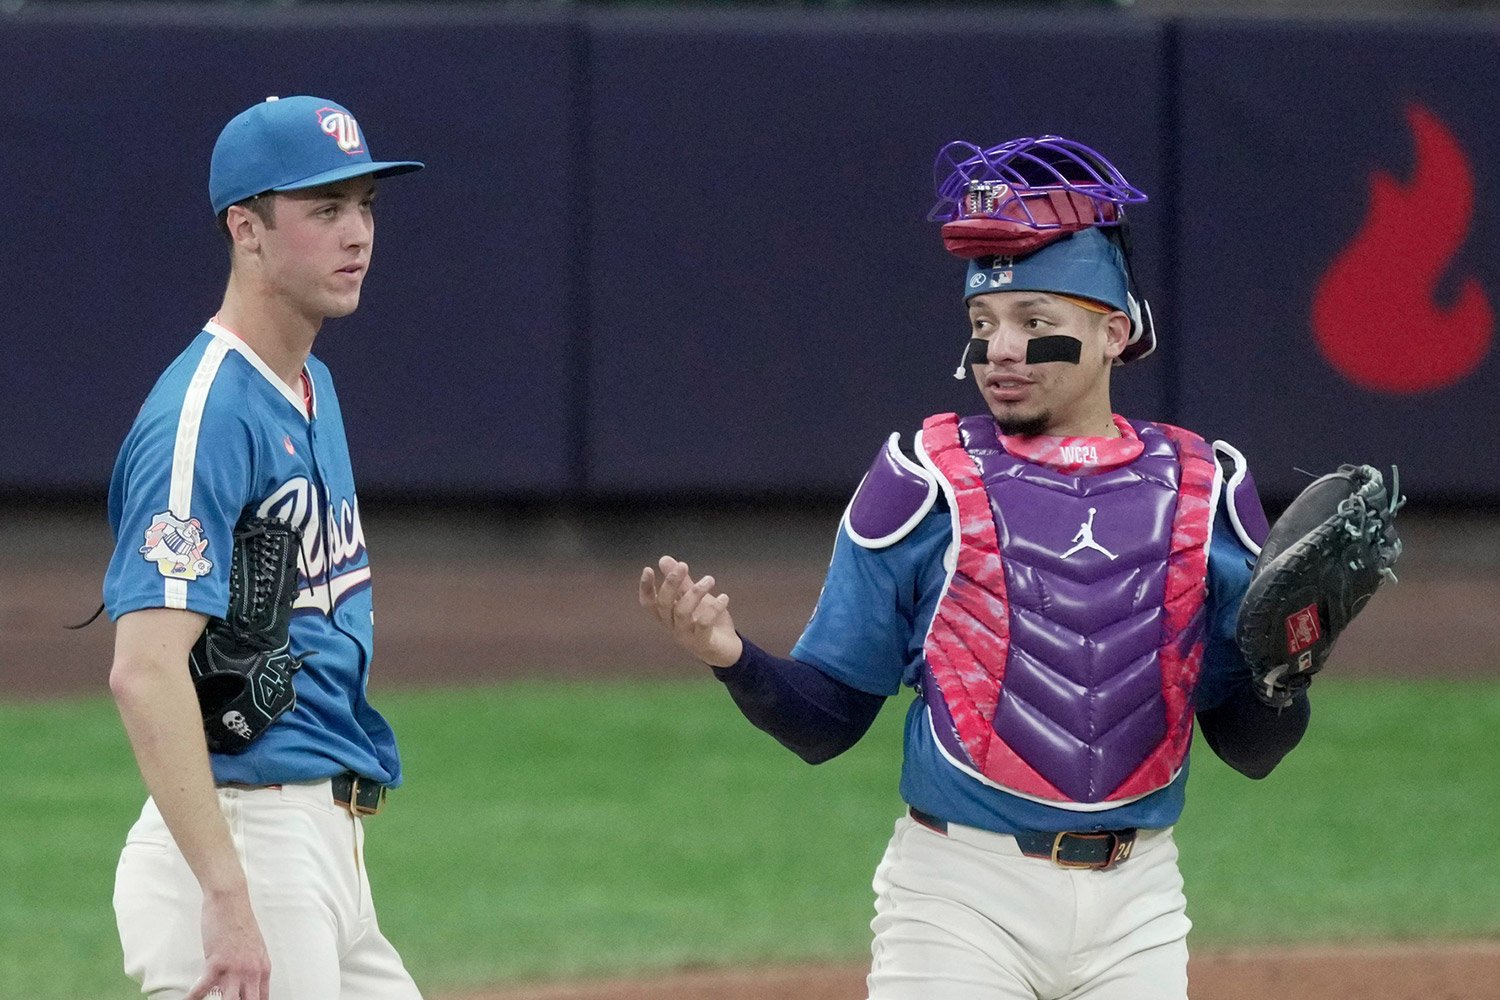 Power rankings have never been harder to trust than they are during the middle months of a baseball season. A hot week can launch a mediocre club into the top ten while a rough road trip suddenly turns a contender into a “team in trouble.” Wins and losses still matter, but they rarely tell the full story of how a team is actually performing beneath the surface. That is where third order wins help separate noise from substance. Based on Clay Davenport’s adjusted standings, this metric strips away some of the randomness that can cloud a team’s record by accounting for factors like run differential, strength of schedule, and ballpark environment. Instead of focusing strictly on what has happened, it provides a clearer picture of how teams should be performing in a more neutral setting. The result is a ranking system built to be more predictive than reactive. Some clubs continue to validate their place among baseball’s elite, while others are surviving on timely hits, bullpen luck, or favorable scheduling. The arrows below reflect how each team’s standing changed from last week as the season continues to take shape. 1. Dodgers — 27.0–12.0 (.692) Biggest Weekly Storyline: Blake Snell made his season debut over the weekend, while Tyler Glasnow headed to the 15-day IL with low back spasms. One of the benefits on LA’s monster payroll is there is plenty of pitching depth. 2. Yankees — 26.7–13.3 (.668) Biggest Weekly Storyline: New York called up top outfield prospect Spencer Jones after outfielder Jasson Dominguez headed to the IL. Jones posted a .258/.366/.592 slash line in 33 games with 11 homers and a 32.4 K%. 3. Braves — 25.8–14.2 (.645) Biggest Weekly Storyline: Legendary manager Bobby Cox passed away over the weekend. He won over 2,500 games as manager of the Braves and Blue Jays and won the 1995 World Series. 4. Cubs — 25.3–14.6 (.634) Biggest Weekly Storyline: The Cubs have two 10-game winning streaks in one season for the first time since 1935. 5. Pirates — 23.4–16.6 (.585) ⬆️ Biggest Weekly Storyline: Paul Skenes threw eight innings of two-hit ball in one of the best performances of his career. He struck out seven, including striking out the side in his final inning. 6. Brewers — 21.6–15.4 (.584) ⬆️ Biggest Weekly Storyline: On Friday, Jacob Misiorowski’s first inning against the Yankees set velocity records for a starting pitcher. He threw 10 pitches all above 102 mph and had a 103.6 mph fastball that set the record for fastest pitch thrown by a starter in the pitch-tracking era. 7. Rays — 21.7–16.3 (.571) Biggest Weekly Storyline: Tampa saw its seven-game winning streak end earlier this week. During that stretch, they set a franchise record of 12 consecutive games giving up three or fewer runs. 8. Marlins — 21.7–18.3 (.543) ⬇️ Biggest Weekly Storyline: Joe Mack, a consensus top-100 prospect, was called up this week. Last season, he had an .813 OPS and a 120 wRC+ in 112 games. 9. Rangers — 21.0–18.0 (.538) ⬆️ Biggest Weekly Storyline: Nathan Eovaldi tossed eight innings and held a red-hot Yankees roster to one run on three hits. He struck out eight and didn’t issue a walk. 10. Cardinals — 20.0–19.0 (.513) ⬆️ Biggest Weekly Storyline: JJ Wetherholt turned a routine single into a “Little League Grand Slam” after the ball slipped under the glove of Fernando Tatis Jr. 11. Tigers — 20.2–19.8 (.505) ⬇️ Biggest Weekly Storyline: Tarik Skubal underwent left elbow surgery to remove bone chips and is expected to miss up to two months. 12. Guardians — 20.4–20.6 (.498) ⬇️ Biggest Weekly Storyline: Cleveland traded for the two-time Gold Glove catcher Patrick Bailey from the Giants for the No. 29 pick in this year’s MLB Draft and left-handed pitching prospect Matt Wilkinson. 13. Blue Jays — 19.3–19.7 (.495) ⬆️ Biggest Weekly Storyline: Dylan Cease is leading MLB in strikeouts (66 K) after a 10-strikeout performance on Friday. In seven shutout innings, he scattered five hits and didn’t allow a walk. 14. Royals — 19.7–20.3 (.493) ⬆️ Biggest Weekly Storyline: Carlos Estevez, the Royals’ closer, will be shut down for the next three weeks with a right rotator cuff strain. Starting pitcher Cole Ragans was placed on the IL with a left elbow impingement. 15. Mariners — 19.7–20.3 (.493) ⬇️ Biggest Weekly Storyline: Luke Raley hit a grand slam and a three-run homer in the same game to help Seattle score a season-high 12 runs. 16. Nationals — 19.3–20.7 (.482) ⬆️ Biggest Weekly Storyline: Gus Varland has quietly earned the closer job in Washington after bouncing around a lot on the waiver wire. His 2.46 FIP and 4.8 BB% could be signs of better future performance. 17. Angels — 19.1–20.9 (.478) ⬇️ Biggest Weekly Storyline: Walbert Urena went six innings, allowing one earned run on two hits with three walks and five strikeouts. The performance brought Ureña’s ERA down to 3.22. 18. Diamondbacks — 18.0–20.0 (.474) ⬆️ Biggest Weekly Storyline: Eduardo Rodriguez gave Arizona their best start of the year. In seven shutout innings, he limited Pittsburgh to two hits while striking out seven. 19. Athletics — 18.0–21.0 (.462) ⬇️ Biggest Weekly Storyline: Nick Kurtz extended his on-base streak to an MLB-best 32-games. He is also tied for the MLB-lead in walks (36) with Mike Trout. 20. Padres — 17.9–21.1 (.459) ⬇️ Biggest Weekly Storyline: Jake Cronenworth has been dealing with bouts of fogginess and difficulty focusing during at-bats as he deals with long-term concussion symptoms. Earlier this year, he was hit in the jaw by a pitch. 21. White Sox — 17.7–21.3 (.454) ⬆️ Biggest Weekly Storyline: Munetaka Murakami has now homered in eight straight series openers, an MLB record that was held by Eddie Murray (1987). 22. Red Sox — 17.4–21.6 (.446) ⬆️ Biggest Weekly Storyline: Connelly Early and Payton Tolle may be saving Boston’s rotation and their season. Early has a 130 ERA+ and a 22.0 K%, while Early has a 205 ERA+ and a 34.3 K%. 23. Phillies — 17.6–22.5 (.439) ⬆️ Biggest Weekly Storyline: Alec Bohm has been one of baseball’s worst hitters this year with a 21 OPS+ and producing -0.8 rWAR. He’s become unplayable for a Phillies team trying to get back into contention. 24. Mets — 16.8–22.2 (.431) ⬇️ Biggest Weekly Storyline: Rumors are already swirling that the Mets have talked to several teams about trading Freddy Peralta. For a team that expected to contend, this is an early white flag. 25. Twins — 17.2–22.8 (.430) ⬇️ Biggest Weekly Storyline: Taj Bradley was placed on the IL with right pectoral muscle inflammation. He was off to a terrific start with a 2.87 ERA and a 1.19 WHIP in 47 innings. 26. Astros — 17.0–23.0 (.425) ⬇️ Biggest Weekly Storyline: Carlos Correa has a torn tendon in his left ankle and will miss 6-8 months. He sustained the injury during batting practice when he swung and felt a pop. 27. Rockies — 16.7–23.4 (.416) ⬇️ Biggest Weekly Storyline: In a tie game, Colorado loaded the bases against Craig Kimbrel with no outs in a tie game. Jake McCarthy cracked a grand slam to send the Mets to another loss. 28. Reds — 15.6–24.4 (.390) Biggest Weekly Storyline: Chase Burns helped the Red snap an 8-game losing streak. In six innings, he allowed one run on four hits with two strikeouts. He has the third-best ERA in the NL. 29. Orioles — 15.4–24.6 (.385) ⬆️ Biggest Weekly Storyline: Shane Baz hasn’t lived up to expectations since being traded to Baltimore. In 39 2/3 innings, he has a 4.99 ERA with a 1.54 WHIP. 30. Giants — 14.8–24.2 (.379) ⬇️ Biggest Weekly Storyline: Logan Webb had made 156 consecutive starts before going on the IL with right knee bursitis. That streak dated back to 2021. What storylines stood out this week? Do you agree with the rankings above? Leave a comment and start the discussion.
 -
Image courtesy of © Sam Navarro-Imagn Images There is no shortage of ways to rank teams across Major League Baseball, but most rely too heavily on wins and losses. Those results matter, yet they often miss the bigger picture. Teams can look dominant or overmatched in short bursts, and traditional power rankings tend to chase those swings rather than explain them. This version takes a different approach. Using third-order wins, derived from Clay Davenport’s adjusted standings, the focus shifts to how teams should perform in a neutral context. By factoring in run production, ballpark effects, and quality of competition, these rankings aim to reflect underlying performance instead of surface-level results. The outcome is a set of power rankings that lean more predictive than reactive, highlighting which teams are positioned for sustained success and which may be riding unsustainable trends. Below you will see updated rankings with up, down, or neutral arrows to show how things changed compared to last week's rankings. 1. Dodgers — 22.4–10.6 (.679) Biggest Weekly Storyline: The Dodgers lost more than three games in a row for the first time this season. They also had a homerless drought that stretched for much of the week. 2. Yankees — 22.2–10.8 (.673) Biggest Weekly Storyline: Will Warren is making a case to stick in New York’s rotation even with Carlos Rodon and Gerrit Cole set to return over the next two months. Warren has allowed two or fewer earned runs in each of his seven starts, the most in the majors. 3. Braves — 22.0–11.9 (.649) ⬆️ Biggest Weekly Storyline: Drake Baldwin has quickly emerged as one of the most surprising breakout stars in the National League. Baldwin ranks among league leaders in OPS and weighted runs created (wRC+), while regularly playing catcher. 4. Cubs — 21.2–11.8 (.642) ⬇️ Biggest Weekly Storyline: Nico Hoerner exited Friday’s game against the Arizona Diamondbacks due to left-sided neck tightness. He entered that game with a slash line of .291/.370/.449 with four homers across 31 contests. 5. Marlins — 19.7–13.2 (.599) ⬆️ Biggest Weekly Storyline: Xavier Edwards is developing into a star for Miami. In his first 32 games, he has an .873 OPS, 146 OPS+, and a 148 wRC+. He ranks near the top of the NL in batting average and OBP. 6. Pirates — 20.0–14.0 (.588) ⬇️ Biggest Weekly Storyline: Mitch Keller pitched seven innings of three-hit ball, and the Pittsburgh Pirates ended a five-game losing streak on Friday night. However, the team’s bullpen cost them multiple wins this week. 7. Rays — 18.2–13.8 (.569) Biggest Weekly Storyline: Ryan Pepiot is out for the season after having hip surgery. Since joining the Rays, Pepiot has a 3.75 ERA, a 4.18 FIP with a 25.4 K% and 8.9 BB% over 297.2 IP. 8. Brewers — 17.9–14.1 (.559) ⬆️ Biggest Weekly Storyline: Jacob Misiorowski had a no-hitter into the sixth inning on Friday before he had to leave the game with a right hamstring cramp. It was his 85th pitch that came on the heels of four consecutive strikeouts. 9. Tigers — 18.6–15.4 (.547) ⬆️ Biggest Weekly Storyline: The Detroit Tigers placed pitcher Casey Mize and infielder Javier Báez on the injured list earlier this week. Mize goes on the 15-day IL with a right adductor strain, while Báez is on the 10-day list with a right ankle sprain. 10. Guardians — 18.1–15.9 (.532) ⬆️ Biggest Weekly Storyline: Travis Bazzana, the organization’s No. 1 overall prospect, made his MLB debut. In his first three games, he failed to record a hit but walked four times. 11. Rangers — 17.5–15.5 (.530) ⬇️ Biggest Weekly Storyline: Wyatt Langford suffered a setback in his return from a forearm injury. During Thursday’s extended spring training game, he felt discomfort in his forearm after his first at-bat of the contest. 12. Angels — 17.8–16.2 (.524) ⬇️ Biggest Weekly Storyline: Mike Trout is back! He leads the AL in runs scored and has an OBP above .400 for the first time in five seasons. 13. Cardinals — 16.7–16.3 (.506) ⬆️ Biggest Weekly Storyline: Albert Pujols and Yadier Molina will be inducted into the Cardinals’ Hall of Fame this September. 14. Mariners — 16.9–17.1 (.497) ⬇️ Biggest Weekly Storyline: The Mariners retired Randy Johnson’s number 51 over the weekend. Johnson spent 10 seasons with the Mariners from 1989 through 1998, going 130-74 with a 3.42 ERA. He also threw the team’s first no-hitter in 1990. 15. Blue Jays — 15.7–17.3 (.476) ⬆️ Biggest Weekly Storyline: George Springer returned from a fractured big left toe, but left Saturday’s game with what looked like a similar injury after being hit by a pitch. However, there was no new fracture. 16. Royals — 15.5–17.5 (.470) ⬆️ Biggest Weekly Storyline: Salvador Perez is not hitting the ball all that hard this year. His career hard-hit rate is 46.3%, but so far in 2026, Perez is hitting the ball hard only 39.6% of the time. 17. Padres — 15.0–17.0 (.469) ⬇️ Biggest Weekly Storyline: Xander Bogaerts has seen improved performance this year. In 30 games (126 ABs), Bogaerts has a .769 OPS with a 114 OPS+. He also has the lowest K-rate (13%) and career-best walk rate (10.7%). 18. Athletics — 15.1–17.9 (.458) ⬇️ Biggest Weekly Storyline: Nick Kurtz walked in his 20th consecutive game on Friday to tie Barry Bonds for the second-longest streak in MLB history. Former Detroit Tigers outfielder and first baseman Roy Cullenbine walked in 22 straight games, establishing the all-time longest streak. 19. Diamondbacks — 14.6–17.4 (.456) ⬇️ Biggest Weekly Storyline: Ildemaro Vargas extended his hitting streak to 27 games on Friday, breaking the major league record for a Venezuelan native. 20. Nationals — 15.3–18.7 (.450) Biggest Weekly Storyline: CJ Abrams broke out of a slump with a series against the Mets. He went 5-for-11, tallying five RBIs, including a home run that proved to be the difference in 21. Twins — 15.1–18.9 (.444) Biggest Weekly Storyline: Byron Buxton is one of baseball’s hottest hitters. He has 10 homers in a 17-game stretch after starting the year on a bit of a cold streak. 22. White Sox — 14.1–18.9 (.427) ⬆️ Biggest Weekly Storyline: Munetaka Murakami’s MLB-leading 13th home run and Noah Schultz’s six shutout innings were the only reasons to watch the White Sox. 23. Mets — 14.1–18.9 (.427) ⬇️ Biggest Weekly Storyline: The Mets have one of baseball’s worst records, but David Stearns said this week that manager Carlos Mendoza’s job is not in imminent danger. 24. Astros — 14.5–19.6 (.425) ⬆️ Biggest Weekly Storyline: Lance McCullers Jr. owns a 6.32 ERA, has walked 17 batters in just 31.1 innings, and has given up 24 earned runs. His WHIP sits at 1.40, and opponents are hitting to an OPS of .776 against him. 25. Rockies — 14.3–19.7 (.421) ⬇️ Biggest Weekly Storyline: Chase Dollander owns a 2.25 ERA with 39 strikeouts in 32 innings. The ninth overall pick in the 2023 MLB Draft is finding success even in the thin mountain air. 26. Red Sox — 13.6–19.5 (.411) ⬆️ Biggest Weekly Storyline: Garrett Crochet was put on the IL with a shoulder injury, but an MRI didn’t show anything other than inflammation. He is shut down from throwing for at least a couple of days while he builds shoulder strength. 27. Phillies — 13.5–19.5 (.409) Biggest Weekly Storyline: The Phillies fired manager Rob Thomson with the team tied for MLB’s worst record. 28. Reds — 13.2–19.8 (.400) ⬇️ Biggest Weekly Storyline: Elly De La Cruz is the first Major Leaguer since 1900 with 10+ homers and 8+ stolen bases before May. 29. Giants — 12.9–20.1 (.391) ⬇️ Biggest Weekly Storyline: The Giants were shut out for the seventh time already this season. 30. Orioles — 12.5–20.5 (.379) ⬇️ Biggest Weekly Storyline: The Orioles put closer Ryan Helsley on the 15-day injured list Friday because of right elbow inflammation. However, the club is optimistic their closer will not miss significant time. What storylines stood out this week? Do you agree with the rankings above? Leave a comment and start the discussion. View full article
-
MLB Power Rankings: Cubs & Marlins In Top 5, Brewers Move Up In Top 10
Cody Christie posted an article in MLB
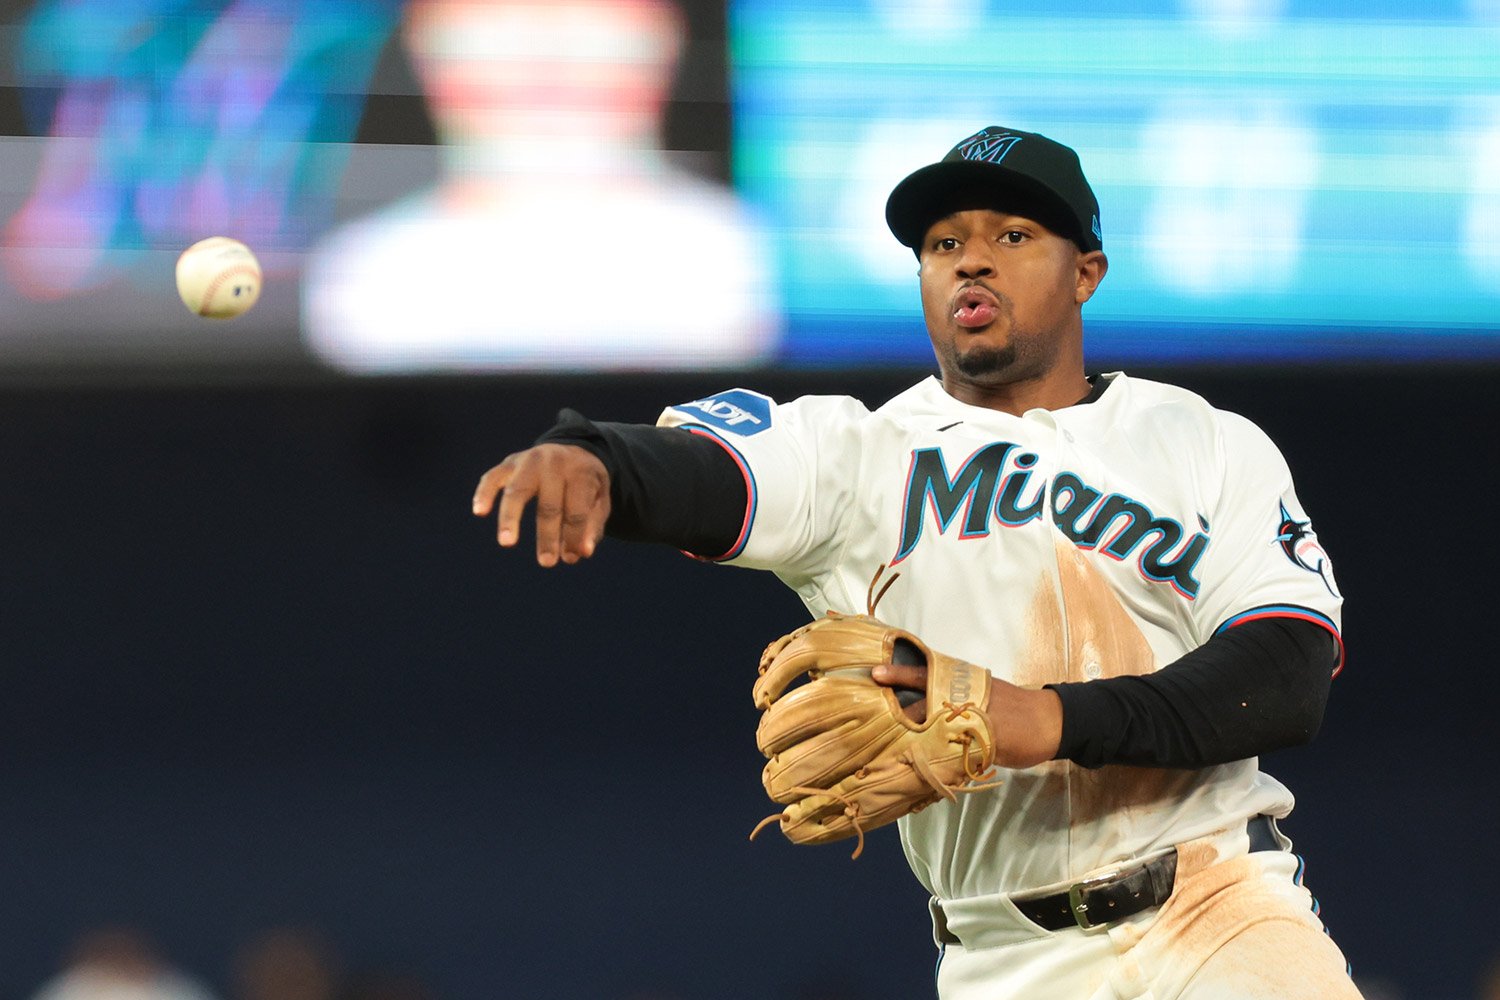 There is no shortage of ways to rank teams across Major League Baseball, but most rely too heavily on wins and losses. Those results matter, yet they often miss the bigger picture. Teams can look dominant or overmatched in short bursts, and traditional power rankings tend to chase those swings rather than explain them. This version takes a different approach. Using third-order wins, derived from Clay Davenport’s adjusted standings, the focus shifts to how teams should perform in a neutral context. By factoring in run production, ballpark effects, and quality of competition, these rankings aim to reflect underlying performance instead of surface-level results. The outcome is a set of power rankings that lean more predictive than reactive, highlighting which teams are positioned for sustained success and which may be riding unsustainable trends. Below you will see updated rankings with up, down, or neutral arrows to show how things changed compared to last week's rankings. 1. Dodgers — 22.4–10.6 (.679) Biggest Weekly Storyline: The Dodgers lost more than three games in a row for the first time this season. They also had a homerless drought that stretched for much of the week. 2. Yankees — 22.2–10.8 (.673) Biggest Weekly Storyline: Will Warren is making a case to stick in New York’s rotation even with Carlos Rodon and Gerrit Cole set to return over the next two months. Warren has allowed two or fewer earned runs in each of his seven starts, the most in the majors. 3. Braves — 22.0–11.9 (.649) ⬆️ Biggest Weekly Storyline: Drake Baldwin has quickly emerged as one of the most surprising breakout stars in the National League. Baldwin ranks among league leaders in OPS and weighted runs created (wRC+), while regularly playing catcher. 4. Cubs — 21.2–11.8 (.642) ⬇️ Biggest Weekly Storyline: Nico Hoerner exited Friday’s game against the Arizona Diamondbacks due to left-sided neck tightness. He entered that game with a slash line of .291/.370/.449 with four homers across 31 contests. 5. Marlins — 19.7–13.2 (.599) ⬆️ Biggest Weekly Storyline: Xavier Edwards is developing into a star for Miami. In his first 32 games, he has an .873 OPS, 146 OPS+, and a 148 wRC+. He ranks near the top of the NL in batting average and OBP. 6. Pirates — 20.0–14.0 (.588) ⬇️ Biggest Weekly Storyline: Mitch Keller pitched seven innings of three-hit ball, and the Pittsburgh Pirates ended a five-game losing streak on Friday night. However, the team’s bullpen cost them multiple wins this week. 7. Rays — 18.2–13.8 (.569) Biggest Weekly Storyline: Ryan Pepiot is out for the season after having hip surgery. Since joining the Rays, Pepiot has a 3.75 ERA, a 4.18 FIP with a 25.4 K% and 8.9 BB% over 297.2 IP. 8. Brewers — 17.9–14.1 (.559) ⬆️ Biggest Weekly Storyline: Jacob Misiorowski had a no-hitter into the sixth inning on Friday before he had to leave the game with a right hamstring cramp. It was his 85th pitch that came on the heels of four consecutive strikeouts. 9. Tigers — 18.6–15.4 (.547) ⬆️ Biggest Weekly Storyline: The Detroit Tigers placed pitcher Casey Mize and infielder Javier Báez on the injured list earlier this week. Mize goes on the 15-day IL with a right adductor strain, while Báez is on the 10-day list with a right ankle sprain. 10. Guardians — 18.1–15.9 (.532) ⬆️ Biggest Weekly Storyline: Travis Bazzana, the organization’s No. 1 overall prospect, made his MLB debut. In his first three games, he failed to record a hit but walked four times. 11. Rangers — 17.5–15.5 (.530) ⬇️ Biggest Weekly Storyline: Wyatt Langford suffered a setback in his return from a forearm injury. During Thursday’s extended spring training game, he felt discomfort in his forearm after his first at-bat of the contest. 12. Angels — 17.8–16.2 (.524) ⬇️ Biggest Weekly Storyline: Mike Trout is back! He leads the AL in runs scored and has an OBP above .400 for the first time in five seasons. 13. Cardinals — 16.7–16.3 (.506) ⬆️ Biggest Weekly Storyline: Albert Pujols and Yadier Molina will be inducted into the Cardinals’ Hall of Fame this September. 14. Mariners — 16.9–17.1 (.497) ⬇️ Biggest Weekly Storyline: The Mariners retired Randy Johnson’s number 51 over the weekend. Johnson spent 10 seasons with the Mariners from 1989 through 1998, going 130-74 with a 3.42 ERA. He also threw the team’s first no-hitter in 1990. 15. Blue Jays — 15.7–17.3 (.476) ⬆️ Biggest Weekly Storyline: George Springer returned from a fractured big left toe, but left Saturday’s game with what looked like a similar injury after being hit by a pitch. However, there was no new fracture. 16. Royals — 15.5–17.5 (.470) ⬆️ Biggest Weekly Storyline: Salvador Perez is not hitting the ball all that hard this year. His career hard-hit rate is 46.3%, but so far in 2026, Perez is hitting the ball hard only 39.6% of the time. 17. Padres — 15.0–17.0 (.469) ⬇️ Biggest Weekly Storyline: Xander Bogaerts has seen improved performance this year. In 30 games (126 ABs), Bogaerts has a .769 OPS with a 114 OPS+. He also has the lowest K-rate (13%) and career-best walk rate (10.7%). 18. Athletics — 15.1–17.9 (.458) ⬇️ Biggest Weekly Storyline: Nick Kurtz walked in his 20th consecutive game on Friday to tie Barry Bonds for the second-longest streak in MLB history. Former Detroit Tigers outfielder and first baseman Roy Cullenbine walked in 22 straight games, establishing the all-time longest streak. 19. Diamondbacks — 14.6–17.4 (.456) ⬇️ Biggest Weekly Storyline: Ildemaro Vargas extended his hitting streak to 27 games on Friday, breaking the major league record for a Venezuelan native. 20. Nationals — 15.3–18.7 (.450) Biggest Weekly Storyline: CJ Abrams broke out of a slump with a series against the Mets. He went 5-for-11, tallying five RBIs, including a home run that proved to be the difference in 21. Twins — 15.1–18.9 (.444) Biggest Weekly Storyline: Byron Buxton is one of baseball’s hottest hitters. He has 10 homers in a 17-game stretch after starting the year on a bit of a cold streak. 22. White Sox — 14.1–18.9 (.427) ⬆️ Biggest Weekly Storyline: Munetaka Murakami’s MLB-leading 13th home run and Noah Schultz’s six shutout innings were the only reasons to watch the White Sox. 23. Mets — 14.1–18.9 (.427) ⬇️ Biggest Weekly Storyline: The Mets have one of baseball’s worst records, but David Stearns said this week that manager Carlos Mendoza’s job is not in imminent danger. 24. Astros — 14.5–19.6 (.425) ⬆️ Biggest Weekly Storyline: Lance McCullers Jr. owns a 6.32 ERA, has walked 17 batters in just 31.1 innings, and has given up 24 earned runs. His WHIP sits at 1.40, and opponents are hitting to an OPS of .776 against him. 25. Rockies — 14.3–19.7 (.421) ⬇️ Biggest Weekly Storyline: Chase Dollander owns a 2.25 ERA with 39 strikeouts in 32 innings. The ninth overall pick in the 2023 MLB Draft is finding success even in the thin mountain air. 26. Red Sox — 13.6–19.5 (.411) ⬆️ Biggest Weekly Storyline: Garrett Crochet was put on the IL with a shoulder injury, but an MRI didn’t show anything other than inflammation. He is shut down from throwing for at least a couple of days while he builds shoulder strength. 27. Phillies — 13.5–19.5 (.409) Biggest Weekly Storyline: The Phillies fired manager Rob Thomson with the team tied for MLB’s worst record. 28. Reds — 13.2–19.8 (.400) ⬇️ Biggest Weekly Storyline: Elly De La Cruz is the first Major Leaguer since 1900 with 10+ homers and 8+ stolen bases before May. 29. Giants — 12.9–20.1 (.391) ⬇️ Biggest Weekly Storyline: The Giants were shut out for the seventh time already this season. 30. Orioles — 12.5–20.5 (.379) ⬇️ Biggest Weekly Storyline: The Orioles put closer Ryan Helsley on the 15-day injured list Friday because of right elbow inflammation. However, the club is optimistic their closer will not miss significant time. What storylines stood out this week? Do you agree with the rankings above? Leave a comment and start the discussion.
 -
Image courtesy of © David Richard-Imagn Images Two decades ago, evaluating defense in baseball was a largely subjective exercise. Fans and analysts relied on the eye test, highlight reels, and basic box score stats like errors and fielding percentage. If a player looked smooth and didn’t make many mistakes, he was probably considered a good defender (*cough*DerekJeter*cough*). The problem, of course, was that those tools left massive gaps in understanding. Range was hard to quantify, positioning was largely ignored, and difficult plays were rarely separated from routine ones. Today, the game tracks nearly everything. With the rise of advanced data systems like Statcast and detailed charting services, every step, route, and reaction is recorded. Analysts can now measure how far a player runs, how quickly he gets there, and how often similar plays are made across the league. Defense has gone from a guessing game to a data-driven science, and at the center of that evolution are three key metrics: DRS, OAA, and FRV. Let’s dive into baseball’s most common defensive metrics. What are they and how are they different? Defensive Runs Saved (DRS) Defensive Runs Saved attempts to quantify a player’s entire defensive performance by measuring how many runs he saves compared to an average player. It incorporates multiple defensive elements, including errors, range, outfield arm strength, and double-play ability. How It’s Calculated DRS uses data from Baseball Info Solutions to track where each ball is hit. For example, imagine an outfielder makes a running catch on a fly ball that is typically caught 70 percent of the time. By making that play, he earns 0.3 points for difficulty. If he misses it, he loses 0.7 points. Over time, these values are compiled, adjusted to league average, and then converted into runs saved. Why It Is Useful DRS provides a more complete defensive evaluation than traditional statistics. Factoring in multiple aspects of defense gives a broader picture of a player’s total impact in the field rather than focusing on just one skill. Recent Leaders During the 2025 season, there were three players who reached the +20 Defensive Runs Saved mark, including Ernie Clement, Steven Kwan, and Ceddanne Rafaela. That total represents a slight increase from 2024, when only two players, Brice Turang and Andrés Giménez, crossed that threshold. The year-to-year fluctuation highlights just how difficult it is to sustain elite defensive production at that level, even for the game’s best fielders. Outs Above Average (OAA) Outs Above Average is a range-based metric that focuses on how many outs a player converts compared to expectation. Originally limited to outfielders, it has since expanded to include infielders, with different calculation methods for each. How It’s Calculated For outfielders, OAA is built on Catch Probability. This accounts for how far a player must travel, how much time he has, and the direction of his movement. Like with DRS, if a player makes a catch with a 60 percent probability, he earns +0.4. If he misses it, he is charged -0.60. Over the course of a season, those values add up to produce a total OAA figure. Statcast also provides additional context: Expected Catch Percentage reflects how often an average fielder would make those plays. Actual Catch Percentage shows how often the player actually converted them. Catch Percentage Added shows the difference between expectation and reality. These layers help explain not just how many plays were made, but how difficult those opportunities were. For infielders, OAA becomes even more detailed. It considers distance to the ball, time available, distance to the base for a throw, and even the runner’s speed. Because Statcast tracks exact positioning, it accounts for defensive shifts and non-traditional alignments. This means a third baseman fielding a ball in shallow right field is evaluated just as precisely as if he were standing in his usual spot. Every play is measured based on where the defender actually starts and how difficult the play truly is. Why It’s Useful Outs Above Average provides a clear and objective way to measure a defender’s range and ability to convert difficult plays into outs. By focusing on the probability of each individual play, it separates routine chances from truly challenging ones, giving proper credit to players who consistently make high-difficulty plays. Because it is built on precise tracking data, OAA also accounts for positioning and shifting, enabling a more accurate evaluation in today’s game, where defenders are rarely standing in traditional spots. This makes it one of the most reliable tools for identifying elite athleticism and real defensive impact. Recent Leaders Outs Above Average often paints a different defensive picture than DRS, focusing solely on range and play difficulty. In 2025, five players surpassed the +20 OAA mark, including Pete Crow-Armstrong, Bobby Witt Jr., Ke'Bryan Hayes, Ceddanne Rafaela, and Masyn Winn. That group was significantly larger than in 2024, when only two players, Andrés Giménez and Jacob Young, reached +20 OAA, reinforcing how rare it is to reach that elite level of range-based performance. Fielding Run Value (FRV) Fielding Run Value builds on the foundation of Statcast by combining multiple defensive components into one all-encompassing number. Instead of isolating one skill like range or arm strength, it brings everything together and expresses a player’s total defensive impact in terms of runs saved. How It's Calculated FRV pulls in several defensive performance areas, including range, throwing, framing, blocking, and double plays. Each of those components is converted into a run-based value using a standardized scale. For example, outs recorded through range are worth slightly less than a full run, while throwing and double play contributions carry their own specific weights. By translating everything into runs, FRV creates a consistent baseline that allows players at different positions to be evaluated on equal footing. Why It’s Useful The biggest strength of FRV is its ability to compare defenders across positions. Catchers, infielders, and outfielders all contribute in different ways, and traditional metrics often struggle to place them on the same scale. FRV solves that problem by turning every defensive action into a common currency. This makes it easier to identify overall defensive value, regardless of how that value is accumulated. Recent Leaders The 2025 season provides a strong example of how FRV captures different defensive profiles. Patrick Bailey led the way with +31 FRV, driven primarily by elite framing behind the plate, where he collected 25 runs. Alejandro Kirk, Ceddanne Rafaela, and Pete Crow Armstrong were all in the +21-22 FRV range, despite playing catcher, second base, and center field. Each player arrived at a similar level of total value, but through very different defensive strengths. What Makes These Metrics Different? While all three metrics aim to measure defense, they do so in fundamentally different ways. DRS is broad and all-encompassing. It pulls together multiple aspects of defense into a single number, making it useful for evaluating overall performance but sometimes less precise at isolating specific skills. OAA is more focused. It zeroes in on range and play difficulty, offering a clearer picture of how well a player gets to the ball and converts chances into outs. It is especially valuable for understanding athleticism and positioning. FRV acts as a translator. It takes the detailed components measured by Statcast and converts them into a common currency of runs. By doing so, it allows for direct comparisons across positions and skill sets, something neither DRS nor OAA fully accomplishes on their own. Together, these metrics represent how far defensive evaluation has come. What once relied on instinct and reputation is now grounded in measurable data, giving fans a clearer and more complete understanding of what truly happens on the field. View full article


